
Factor Investing: The Lazy Investor's Guide to Outperformance
Follow the proven drivers of long-term wealth without active stock-picking. Profit from data hiding in plain sight.


Have you ever wondered if there were certain common traits or DNA in stocks that are bound to outperform the market? If they shared some characteristics that increase their probability of achieving high returns in the near future? Look no further.
Researchers already mapped out the factors that drive excess returns decades ago. Together, these factors explain more than 70% of above-market returns in stocks (more than 90% according to some research). They’re widely used in institutional finance, but most retail investors don’t know how to benefit from them.
This post is my introduction to factor investing. I will explain what it is, how it works, and how you can easily use it in a strategy for outperformance.
New to The MarketFighter Strategy?
I write about a simple approach to beat the stock market with only 15 minutes of monthly work that anyone can copy. Check out these links:
➡️ The quick introduction
➡️ The detailed breakdown of the strategy
What is factor investing?
You have most likely heard about small-cap stocks, value, or momentum investing. Maybe even quality stocks without fully understanding what that quality specifically meant. These are all called factors, and I will explain them individually in a minute.
Investing is mostly perceived through the lens of active stock-picking: You research and analyze a large amount of stocks based on a set of criteria you believe have positive effect on the future returns.
Here’s the interesting part: That set of criteria is not nearly as secret or vague as most investors tend to think. Our brains are wired to believe we are good at identifying complex patterns ourselves, and that we can somehow use these to predict the future. Unfortunately, we can’t.
Most of the excess returns achieved by successful investors like Warren Buffett can be attributed to the factor exposure of their selected stocks. They may have picked these stocks directly or indirectly because of their high factor exposure. Or they may simply have been lucky to pick stocks that had these characteristics.
Academic research has done most of the work for us. Since the early 1990s, researchers have mapped out the traits or factors that have a high probability of predicting near-term outperformance. Based on these findings, MSCI created specific indexes to track the factors, starting in the late 90s. This is how they have performed:
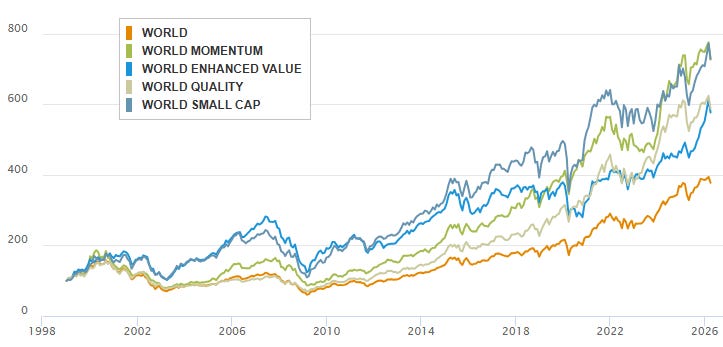
Notice how all four factors have significantly outperformed the general World index. Also, notice how they have done this AFTER they were published and revealed to every curious mind on the globe with an internet connection!
More than 200 investment factors have been documented, but the vast majority of them are either overlapping or simply other factors in disguise. The four factors I’m covering in this post are the ones behind most of the excess returns in stocks.
Each of the factor indices were created using a filter applied to the World index. The filters are different for each factor. Let’s dig into them.
The Value Factor
The most intuitive of the four factors is the value factor. It simply filters companies based on their valuation, and only buys the cheapest ones. The definition of cheap varies. Typically, it involves looking at one or more of the following metrics:
Price to earnings (P/E)
Price to book value (P/B)
Price to free cash flow (P/FCF)
The lower the values the better, and the more the company is said to be exposed to the value factor. This can seem intuitive: The lower the valuation, the more potential for price increases in the stock. Unfortunately it’s not always that simple, but historically it has generated excess returns over long time horizons, if you bought the 20-30% cheapest stocks and rebalanced consistently.
You can say that you are being paid a premium to take on the risk of owning businesses that other investors don’t want to own (hence, the low price).
🟢 Annual outperformance: 2.92% (*)
The Size Factor
The size factor is equally easy to understand. You will often see it labelled as Small-Cap. It’s all about market capitalization size (the total market value of the company). Historical research shows a reverse linear connection between size and returns. In other words: The smaller the company, the higher the average future returns.
Again, it’s not always as simple as that. Small stocks tend to be more volatile with a few big winners and a lot of losers. But if you bought a wide small-cap index at the turn of the millennium, you would have made a ton of money by now.
The size factor (or small-cap) indices and ETFs simply filter the wider market index by size, buying all the 20-30% smallest companies and rebalancing consistently (typically monthly, or quarterly). In this case you are being paid a premium for owning smaller companies with a higher risk related to their business.
🟢 Annual outperformance: 1.87% (*)
The Momentum Factor
Counterintuitive, yet undeniable, is the momentum factor. Research shows that the stocks with the biggest gains in the past 6-12 months have the highest probability of near-future outperformance. In other words: The 20-30% of stocks in the index that had already seen the largest gains in the recent past were bound to continue the outperformance.
Although the momentum factor is probably the least intuitive factor, it’s also the one that has delivered the highest returns historically. But it comes with a caveat of sudden reversals and steep declines when the market direction changes from time to time. As a long-term investor in momentum stocks, you will need to have the discipline to stick to it, even during these sharp reversals.
If you have the stomach to hold on to it, you may receive a significant risk premium.
🟢 Annual outperformance: 6.38% (*)
The Quality Factor
What is quality? It can refer to almost anything, but when we talk about the quality factor in investing, it relates to the quality of earnings and profits. Business stability, predictability and business moats are all part of it as well.
You can look up the exact definitions used by MSCI for their index methodology, but in general you can expect a business to have a high exposure to the quality factor, if it is consistently and increasingly profitable.
It may seem strange that investors should receive a premium for investing in stable quality companies that consistently make a lot of money. And it is. But for a lot of people, these are perceived as boring investments. Quality companies are typically not rocket stocks with potential to go to the moon. They are the sleep-well-at-night stocks that just quietly grow their business year after year.
🟢 Annual outperformance: 3.20% (*)
(* The performance metrics cover the period from 1963 to 2024 and is based on long/short portfolio data from the Ken French Data Library.)
The probability of outperformance
In all of my work I look for high probability of outperformance. So does Andrew Berkin and Larry Swedroe in their amazing book Your Complete Guide to Factor-Based Investing, which I highly recommend, by the way.
Here’s what they calculated based on historical data for the primary factors:
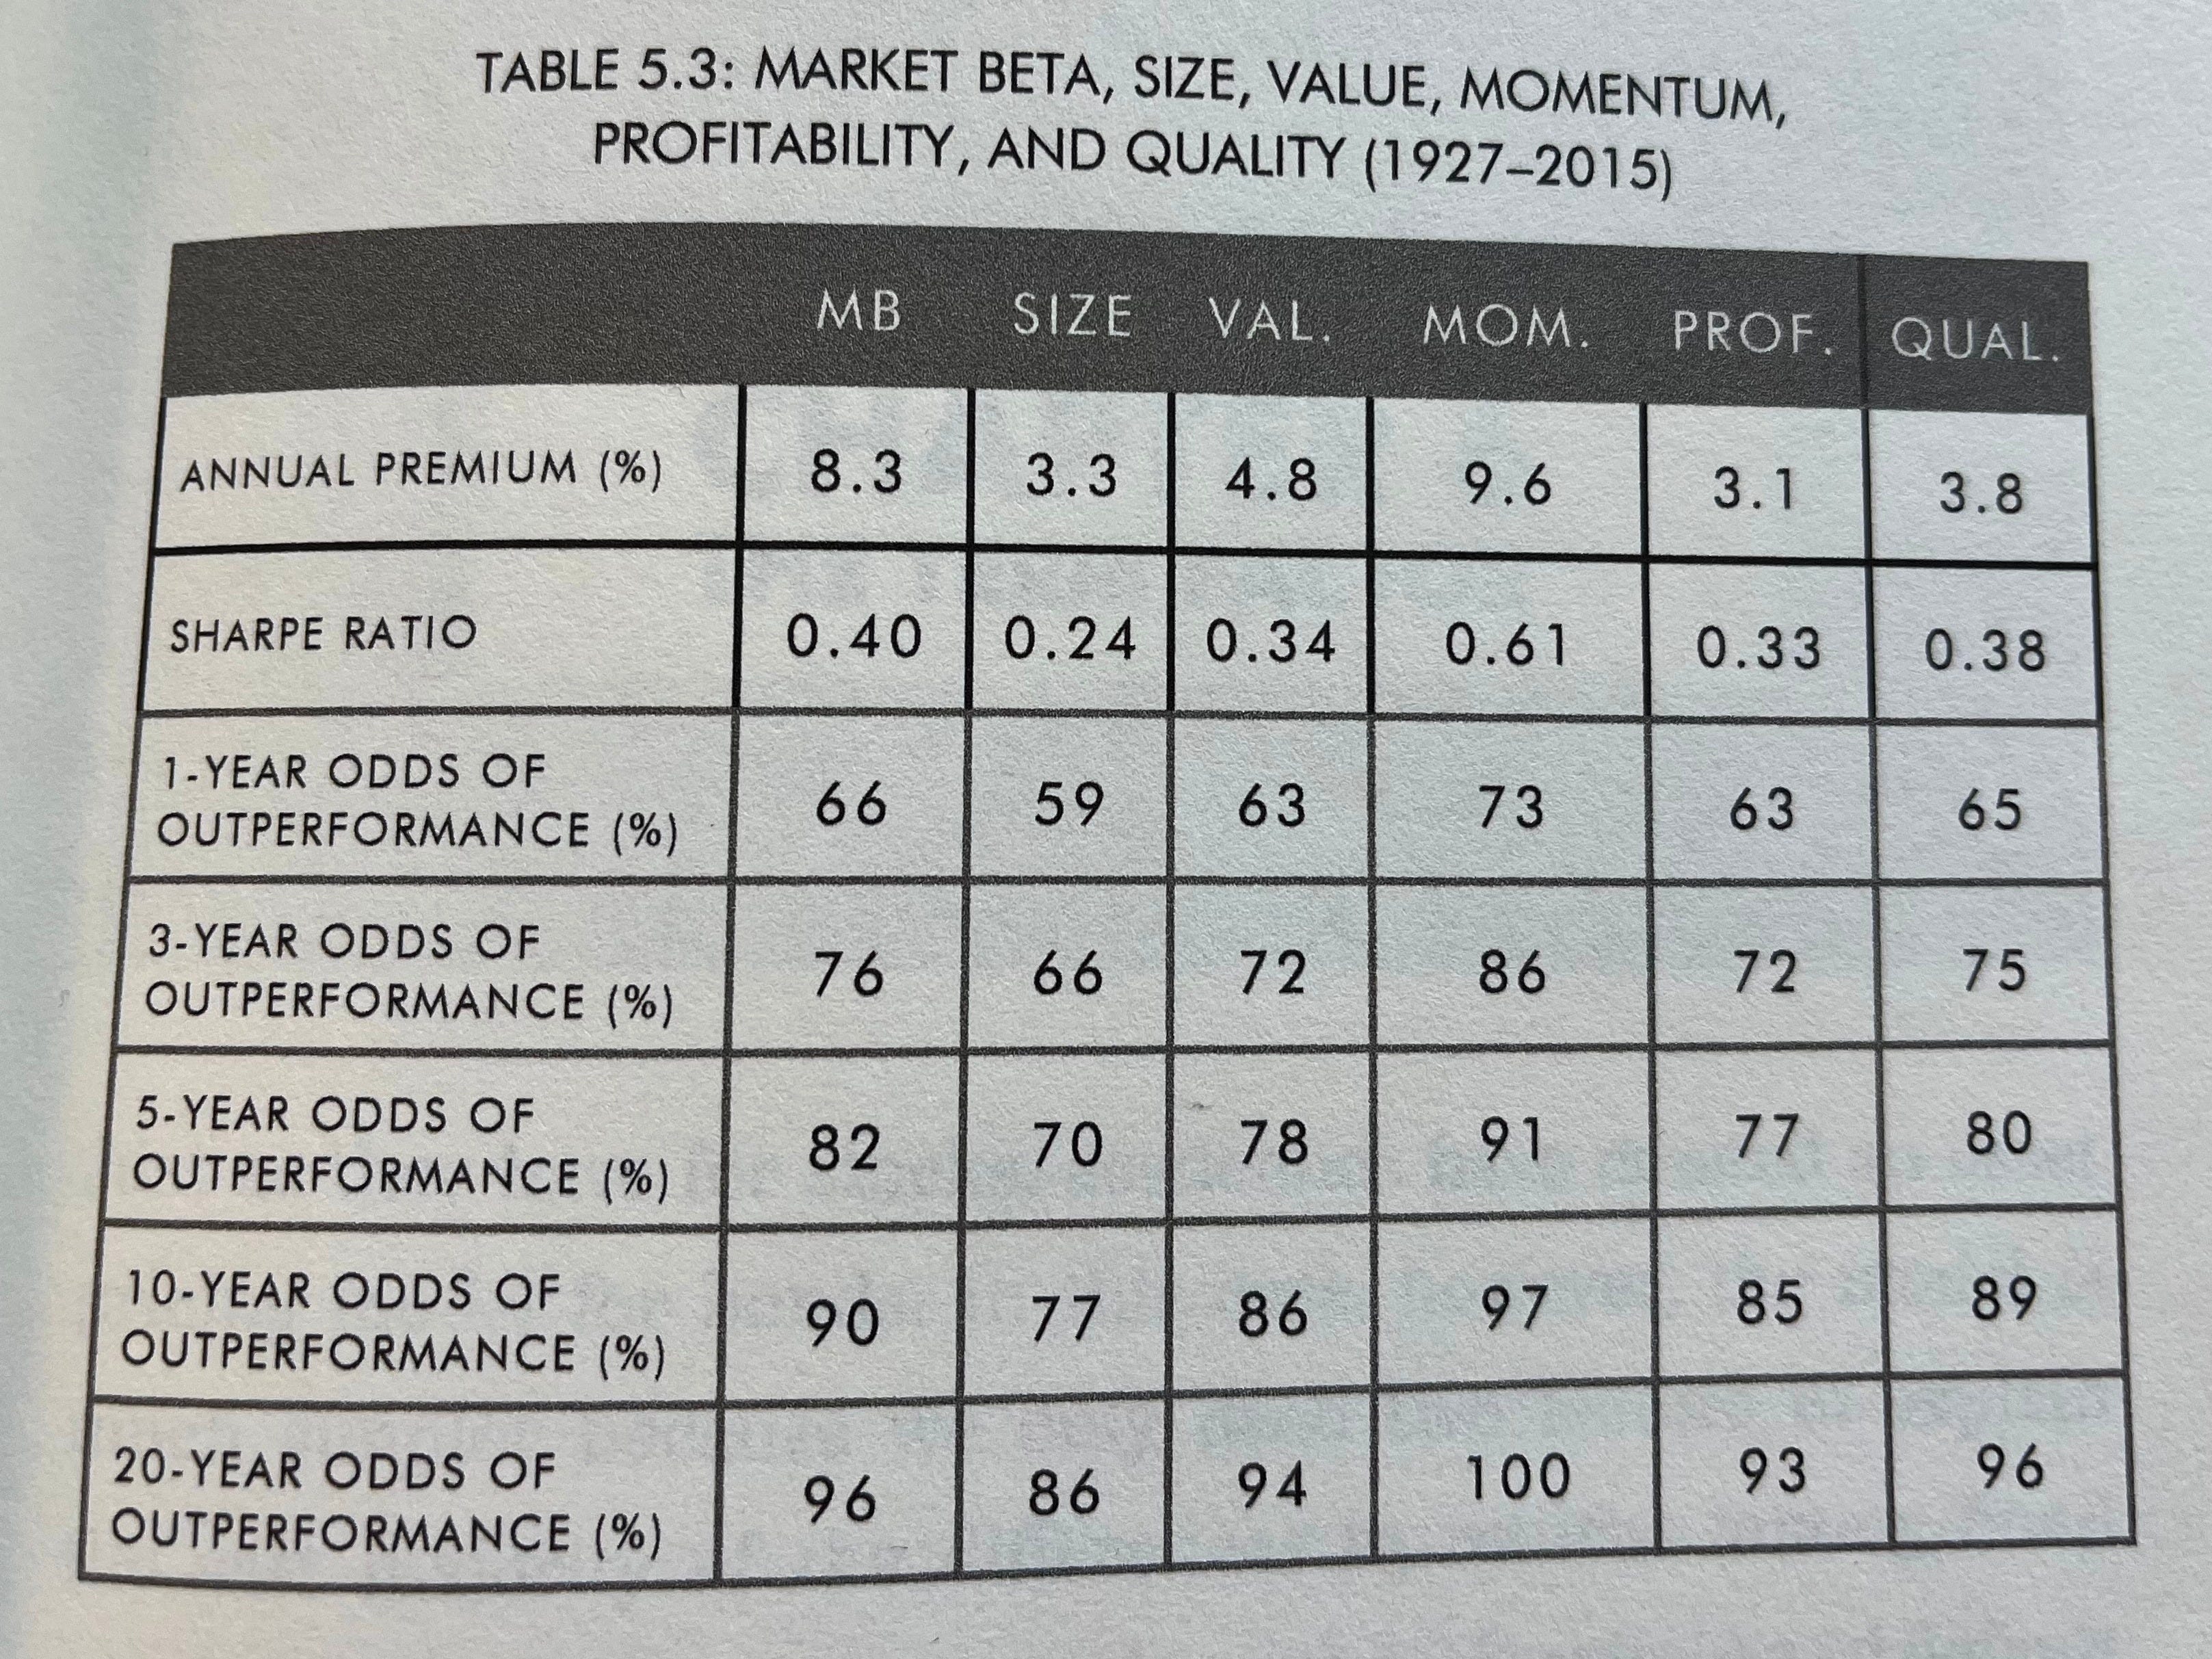
The table shows another calculation of premiums based on long/short portfolios backtested all the way back to 1927. But what’s even more interesting is the calculations of the odds of outperformance while holding each factor. Notice how it increases with the holding time.
Wait. Where’s the caveat?
Did this almost seem too good to be true? If it was that easy to achieve market-beating returns, everyone would buy factor ETFs instead of the pure index funds. But here’s the problem:
Although factors have exhibited excess returns over long time horizons, they have all faced severe drawdowns and prolonged periods of underperformance relative to general market benchmarks.
It takes an immense amount of discipline and patience to stick to an investment through 10 years of underperformance. This is exactly what happened to the value factor not long ago in 2010-2020, and similar bad periods have occurred for other factors as well.
To sum up: What we have here is a range of premium effects that historically generated significant outperformance, if only you could stick to them long enough. But few people possess the patience and discipline to stomach this. The FOMO when comparing to an index fund that keeps winning as years go by is almost humanly impossible to stand.
How can factors be used to outperform?
I have been there, investing for the long term in factor-based ETFs, only to realize I had no clue which of the factors would do well in the near future.
I realized the only way I could really benefit from factor investing was to find a way to rotate between the factors based on data. This led to a lot of research and to eventually developing a strategy that incorporates factor ETFs as a major pillar.
ETF rotation is becoming increasingly popular. The idea is that you rotate between a well-defined basket of ETFs (e.g. factor-based ETFs) at consistent intervals, buying only the one that performs the best according to certain criteria.
I found that relative price momentum can work really well with factors. This is a common technique used in trading systems design. By looking at historical price data you can compare the factors and order them by recent performance. And here’s the kicker:
Choosing the factor with the strongest performance during the past 1-12 months takes out most of the bad “factor stints”, if you simply rebalance at consistent intervals (like at the start of each month).
If you have followed my work, you may already know how my strategy works and how it has performed. If not, you can read about it here:
➡️ My Investment Approach that Outperformed the Stock Market in 25 of 26 years
The essence of the MarketFighter Strategy is to harness the power of relative price momentum on factors as well as on sectors with a drawdown protection layer on top. Having a system to calculate this eliminates all the gut feeling and human bias.
Combining these three pillars has created a remarkably consistent strategy that significantly outperformed the market over the past 25+ years. It does not require any business analysis, stock picking or news reading.
My system calculates the trades needed to follow the strategy each month and I send them to subscribers before the market opens. I have traded the same system with my own money for more than five years now. Subscribe if you want to follow along.
Thanks for reading!
Disclaimer: The MarketFighter Strategy is for educational and informational purposes only. It is not financial advice, and the author is not a licensed investment advisor. Investing in ETFs involves significant risk, and past performance is never a guarantee of future results. You are solely responsible for your own trades and financial outcomes. Read the full Disclaimer here.
Great piece.
What stands out is that factors are not really the hard part—sticking with them is.
Most investors abandon a sound strategy during the years it looks broken, only to chase what recently worked.
In investing, discipline often matters more than selection.
Excellent piece on factor DNA. Sticking through a decade-long factor underperformance slump is definitely the ultimate psychological hurdle.
I try to insulate myself from this by barbelling my global exposure: holding VT for raw market-cap drift and PAYG for an active, covered-call overlay.
Because PAYG focuses on cash-flowing global leaders and distributions are paid twice a month, it satisfies the behavioral need for constant returns even when specific growth factors stall.
In your rotation model, how do you handle periods where multiple factors are highly correlated, like Quality and Momentum blending together during mega-cap bull runs?