
My Investment Approach that Outperformed the Stock Market in 25 of 26 Years
How I built a simple system to consistently outperform the World Index without taking more risk. It's easier than you think.

Can you beat index investing in the long run? Most people can’t. Even most professional fund managers and analysts can’t. Anyone can hit a lucky streak of a few good years, but very few manage to persistently win over a decade or more.
In this article, I will explain how I found a way to consistently outperform the markets. The system is simple. It has worked for more than 25 years. And it’s easy for anyone to copy, if you follow along.
Why is it so difficult?
Outperforming the market is notoriously difficult because stock returns are heavily skewed. A tiny fraction of "superstar" stocks account for nearly all of the index's long-term gains. If you don’t happen to own those few massive winners, you are almost guaranteed to underperform the aggregate average.
My own journey of investing illustrates the point:
When I first started out more than 20 years ago, I pursued “hot tips” in newspapers and shady internet communities.
Figuring I wouldn’t be able to gain an edge doing fundamental analysis, I started studying technical analysis and trend following, inspired by the Turtle Traders and countless other books I read on the subject.
Then I read books on contrarian investing, convinced that doing the opposite of the “losing crowd” would eventually make me a winner.
At some point, after many years of failing to beat the market, I concluded that index investing was the only way forward. At least it provided better returns than all my previous attempts.
Somehow the index returns were just not enough for me, and my curiosity led me to research factor investing, partly inspired by Jeremy Siegel’s famous book Stocks for the Long Run.
The list above is a brief breakdown of 15 years of my own mediocre experience on the stock market. None of the strategies materialized into returns that fulfilled my quest for winning in this game.
How can you actually beat the market?
If you haven’t heard about factor investing, it’s a term for investing based on factors that academic research has identified as having high probability of predicting above-market returns.
Simply put, stocks with high exposure to one of the following factors have historically performed better than the overall market (on average, and over decade-long time horizons, that is):
VALUE 🪙
Stocks that are trading at relatively low pricesMOMENTUM 🏃
Stocks that have recently performed better than mostQUALITY 💎
Stocks with high and consistent profitabilitySIZE 🐣
Stocks with relatively small market capitalization value
An ETF consisting of stocks with high exposure to any of these factors would have outperformed the market significantly, if you had owned it for 20+ years.
But here’s the problem:
The relative performance of these factors is very inconsistent and has extended (sometimes decade-long) periods of underperformance relative to the market. This makes it psychologically next to impossible to stick to these strategies.
The missing ingredient
Obsessed with the idea of outperforming the market, I kept studying, reading books, blogs, academic research and everything that could get me closer to my goal.
A book titled Dual Momentum Investing by Gary Antonacci inspired me to do my own research into ETF-rotation. The idea was simple:
Find a small set of ETFs that tend to move up and down in trends, but with low correlation to each other - when one goes down, one of the others typically go up.
Then set up an interval (1 month for instance) for checking which ETF had the best performance over a given period (12 months for instance).
Finally, put your money into the ETF with the best relative performance over the defined period.
Repeat the steps above each month.
It struck me, that this concept could be the missing ingredient for factor investing. If I could find a way to rotate successfully between specific factor ETFs, that would make things really interesting.
I wanted to build a simple system like Antonacci’s that could tell me each month which factor to invest in. At the same time, turning it into a system would eliminate all human emotion and gut-feeling in the decision-making.
Most investors fail because they sell during drawdowns or buy the top of a fad. Having a simple system make my decisions would be a game-changer.
Back-testing and confidence
I was also aware that I would never fully rely on this system, if I didn’t feel 100% confident in its performance and consistency. The only way I could gain this confidence was to build a huge back-test. So I found performance data for the MSCI factor indices going back to 1999 and tested various combinations of rebalancing and look-back intervals, factors to include and regions to consider.
And that’s when it happened. No matter which look-back period or rebalancing interval I tried, the resulting system outperformed the market significantly!
I was mind-blown. The concept of mixing academic factor investing with simple momentum-based rotation turned out to be a recipe for winning in the stock market.
These were the results I originally got when testing over the 21-year period from 2000 to 2020:
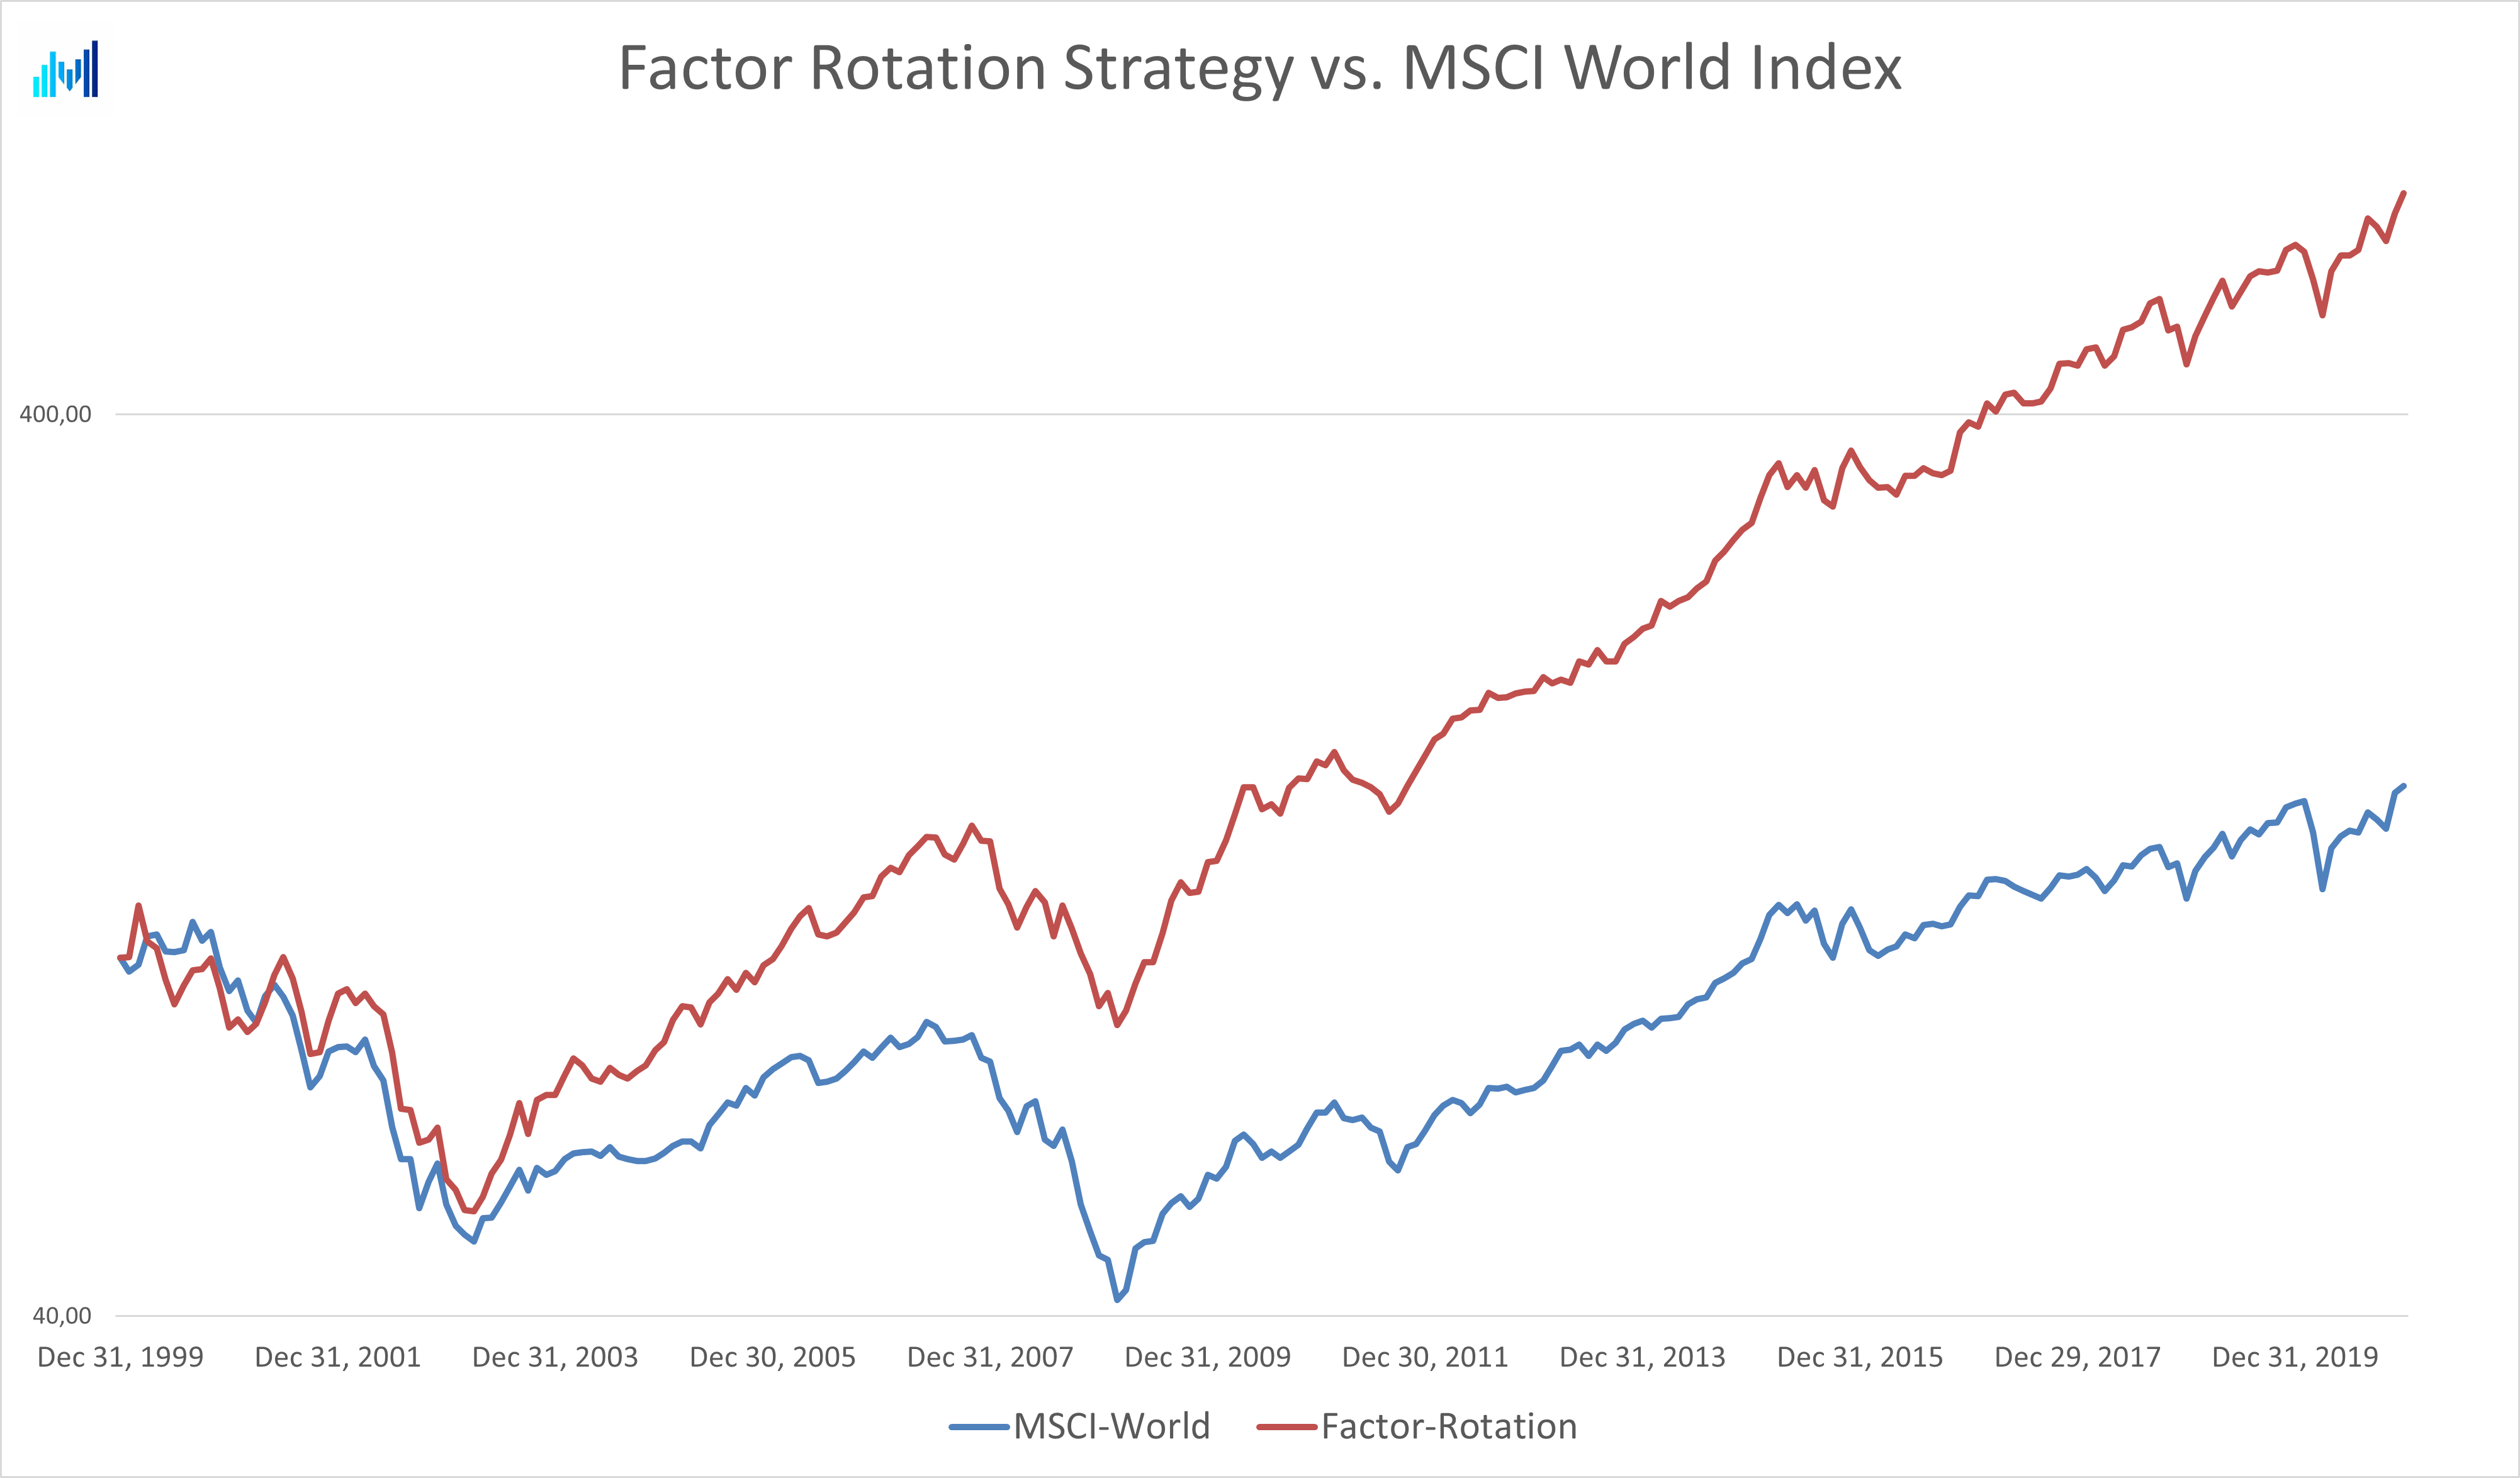
The skepticism
I’m always extremely skeptical when someone claims they are able to beat the market. Usually it can be attributed to one of the following scenarios:
You were lucky to pick some stocks that did well for a while (fooled by randomness), but you believe it was pure skill.
You hold an ETF or fund that did better than the market over a given timeframe and believe it will continue indefinitely.
You created a trading system and overfitted it, to make the back-test look great.
Since my case of outperformance was based on a back-tested trading system, you would think the last bullet (overfitting) played a part. And even though the entire system is based one single piece of output (monthly prices), I was still worried that my back-tested results would not continue.
That’s why I didn’t go public with my idea in the beginning in 2021. I just started trading it myself, putting more and more money into it and gaining more and more confidence as the numbers continued to shine.
The volatility and declining markets in 2022 was a great proof of the concept. Not only did the system survive. It smashed the index, delivering a positive return of more than 10%. This was real, and not just back-tested data anymore.
And here I am, five years later. Five years of continued outperformance in each calendar year compared to the MSCI World Index. Now with the confidence that my finding was real, and not just the result of a poorly designed back-test.
Combining factors with sectors
Still buzzing over the potential of my finding, I kept thinking about other applications of the concept. I wanted a system that would be easy to implement as a retail investor, and factor indexes are super easy to implement, because there are ETFs available that capture these already.
This soon led me to apply the same concept to sectors. There are ETFs available for each sector of the market as well, and applying the same simple momentum-based rotation principle to these yielded even better results, although with slightly higher volatility and annual fluctuations:
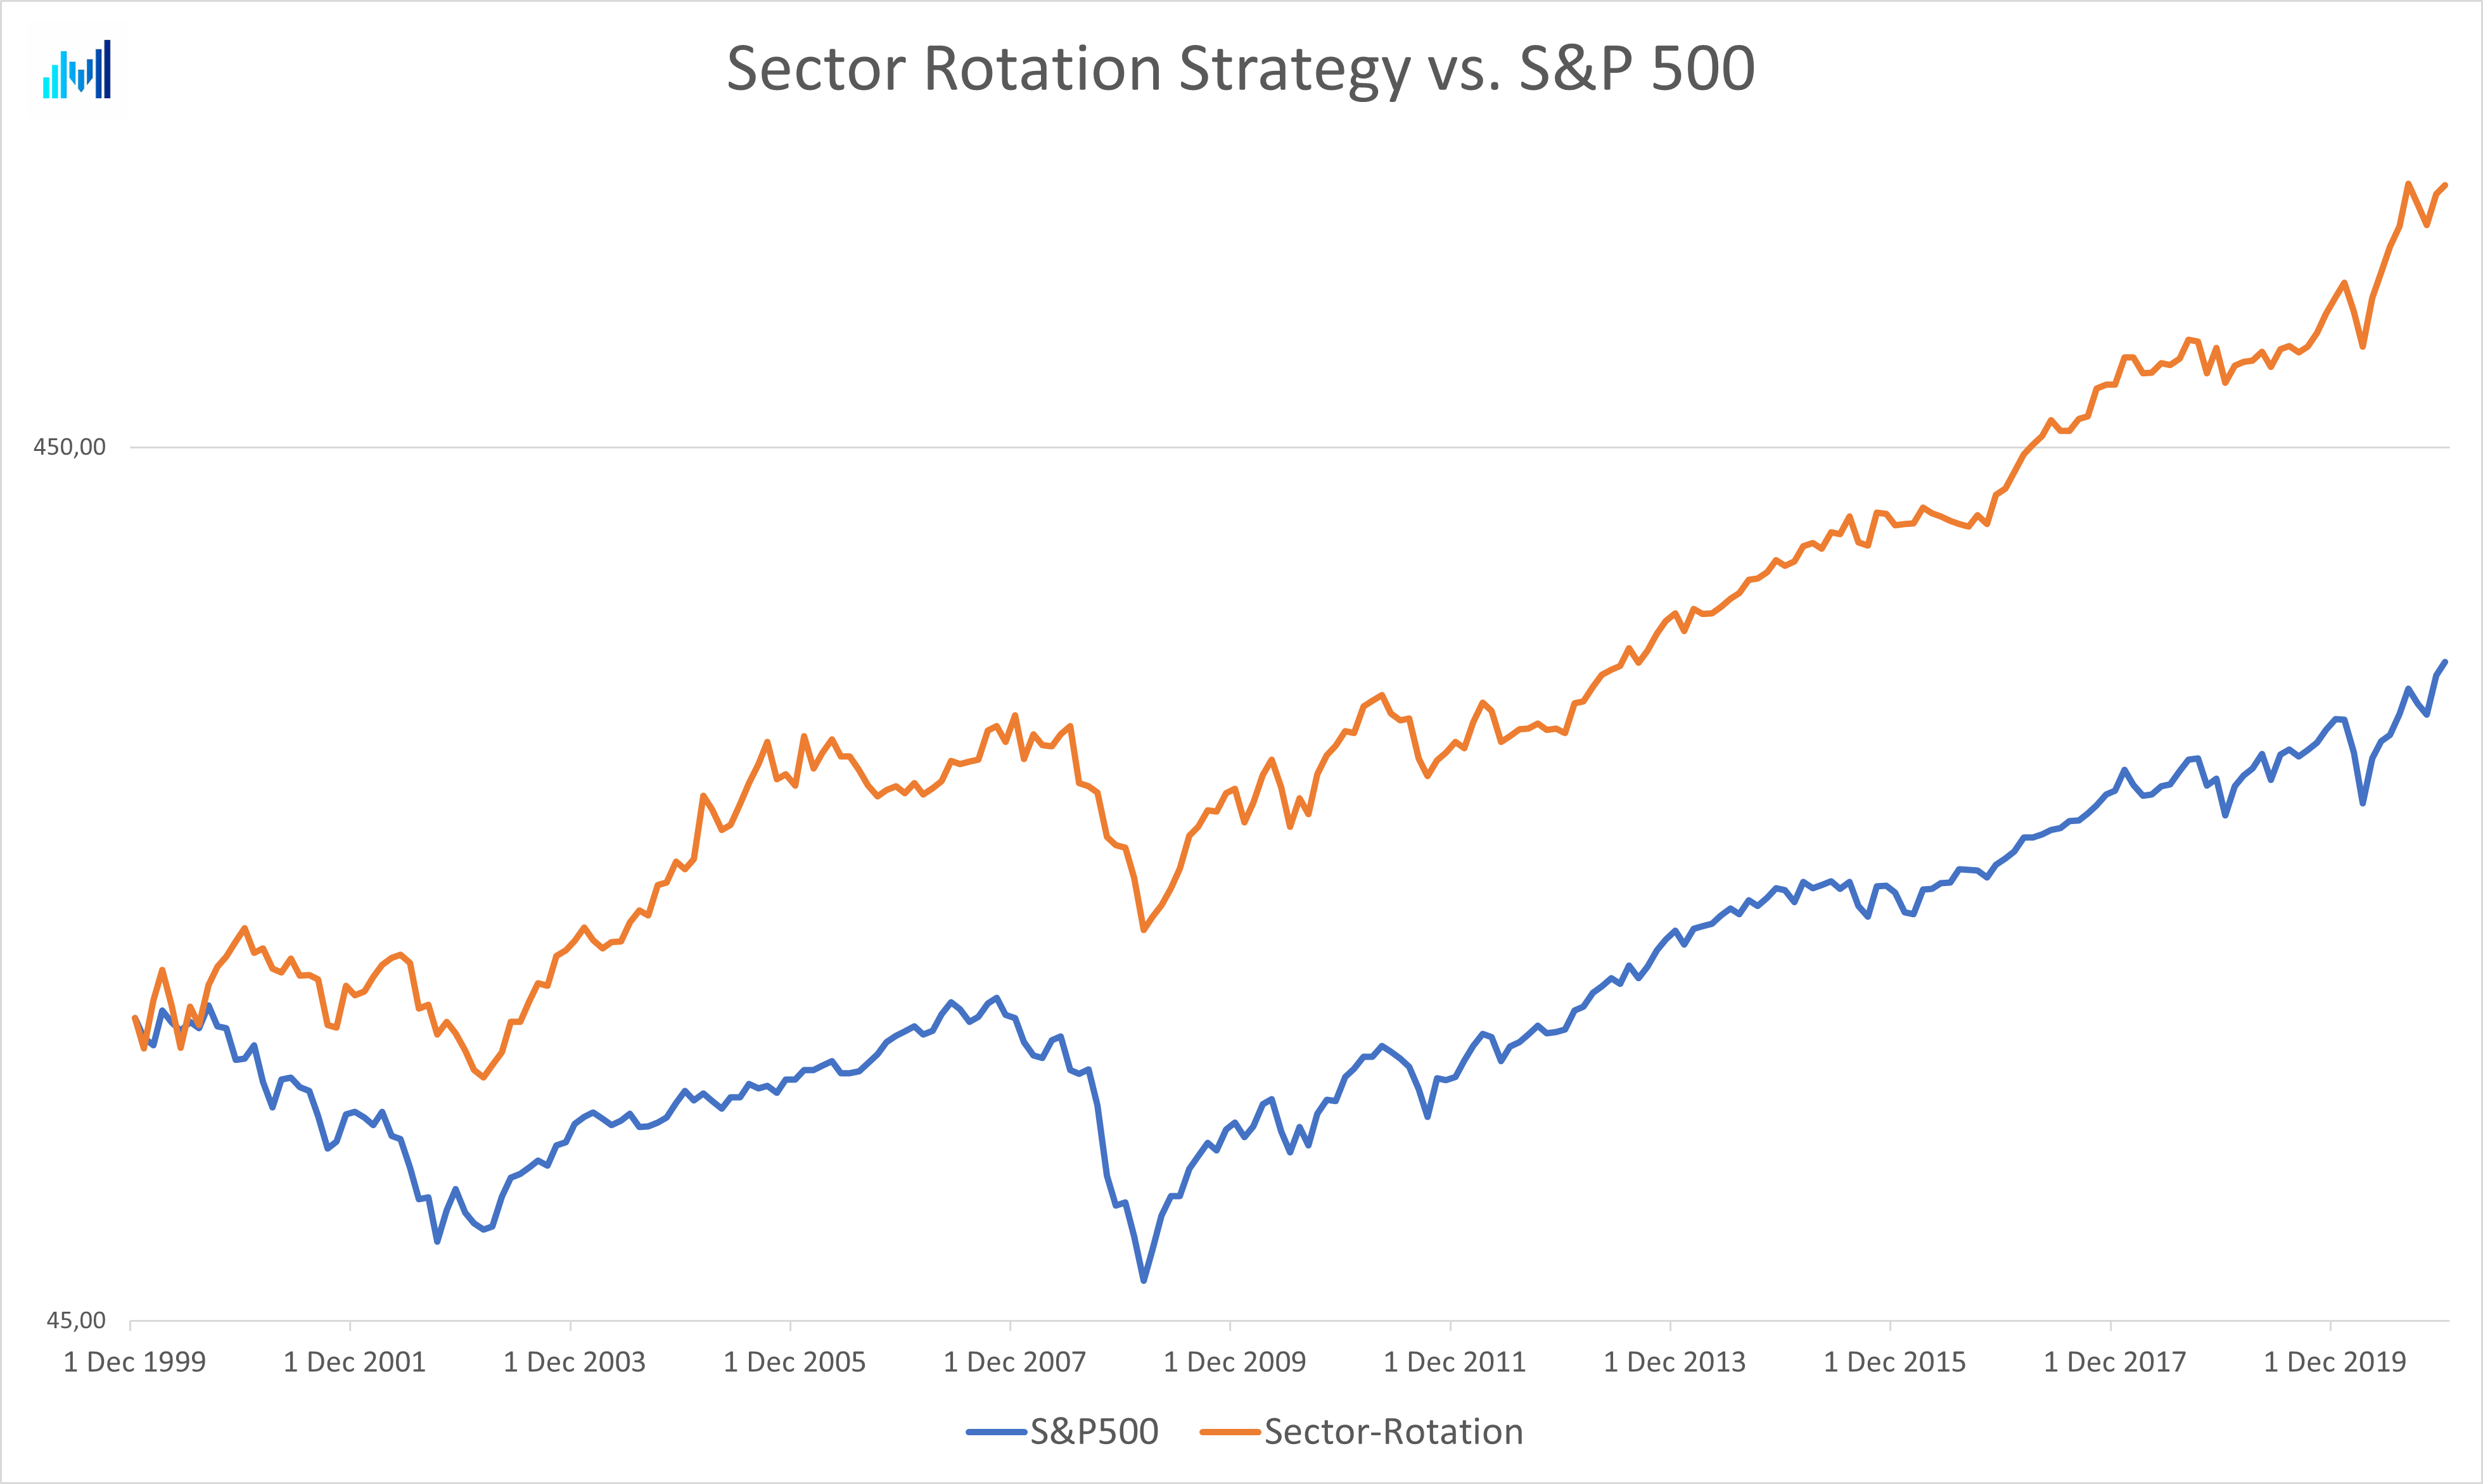
Combining the two strategies created a huge diversification benefit: Both delivered strong outperformance, but at different times. Sometimes the Momentum Factor stocks would be down, but then the Energy Sector stocks would go up, for instance. This helps in smoothing the distribution of returns and makes you sleep better at night.
The final piece: Drawdown protection
As a final piece to the puzzle, I had a theory growing in my head that I would try to apply the same momentum logic to the market itself - not rotating it with other assets, but with NOT being in the market. If this could work in practice, I would get a means of drawdown protection - systematically going cash, when momentum tells me to.
So, again I sat down and played with the data, trying out variations of simple lookback intervals of momentum. And again I had positive results, almost no matter which combination I tried. Momentum really is everywhere, and the possibilities for application are vastly underestimated.
Testing on monthly S&P 500 data all the way back to 1871, my simple drawdown mitigation mechanism would have delivered superior returns and avoided the deepest drawdowns on the way:
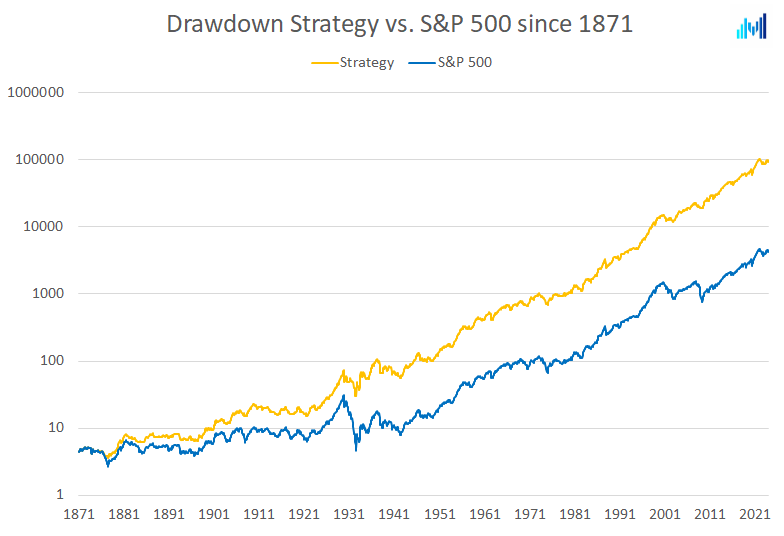
You may notice that most of the outperformance comes during the great crashes: The Great Depression of the 1930s, The Great Financial Crisis in 2008, the DotCom Bubble in 2000-2002 and the great oil crises of the 1970s.
This setup was achieved ONLY by applying a simple rotation filter that looks back on monthly prices of the market index.
Putting it all together
Now, let’s put it all together to form the system I have been investing my personal funds in for the last five years.
In both the Factor and the Sector strategies I apply the drawdown protection strategy. This improves the average returns significantly, but only by going to cash in certain months during deep crashes. These are rare occasions. The system has been invested in the market in 93% of the entire period.
Now that both of the core strategies have been improved by the drawdown strategy, I simply put 50% of my money into each of them.
So, to put it short: At the turn of each month, I check which factor index had the best relative momentum according to my lookback. Then, unless the drawdown check signals a move to cash, I put 50% of my money into the corresponding ETF. Exactly the same procedure goes for the sector strategy.
Execution of this strategy takes less than 15 minutes per month.
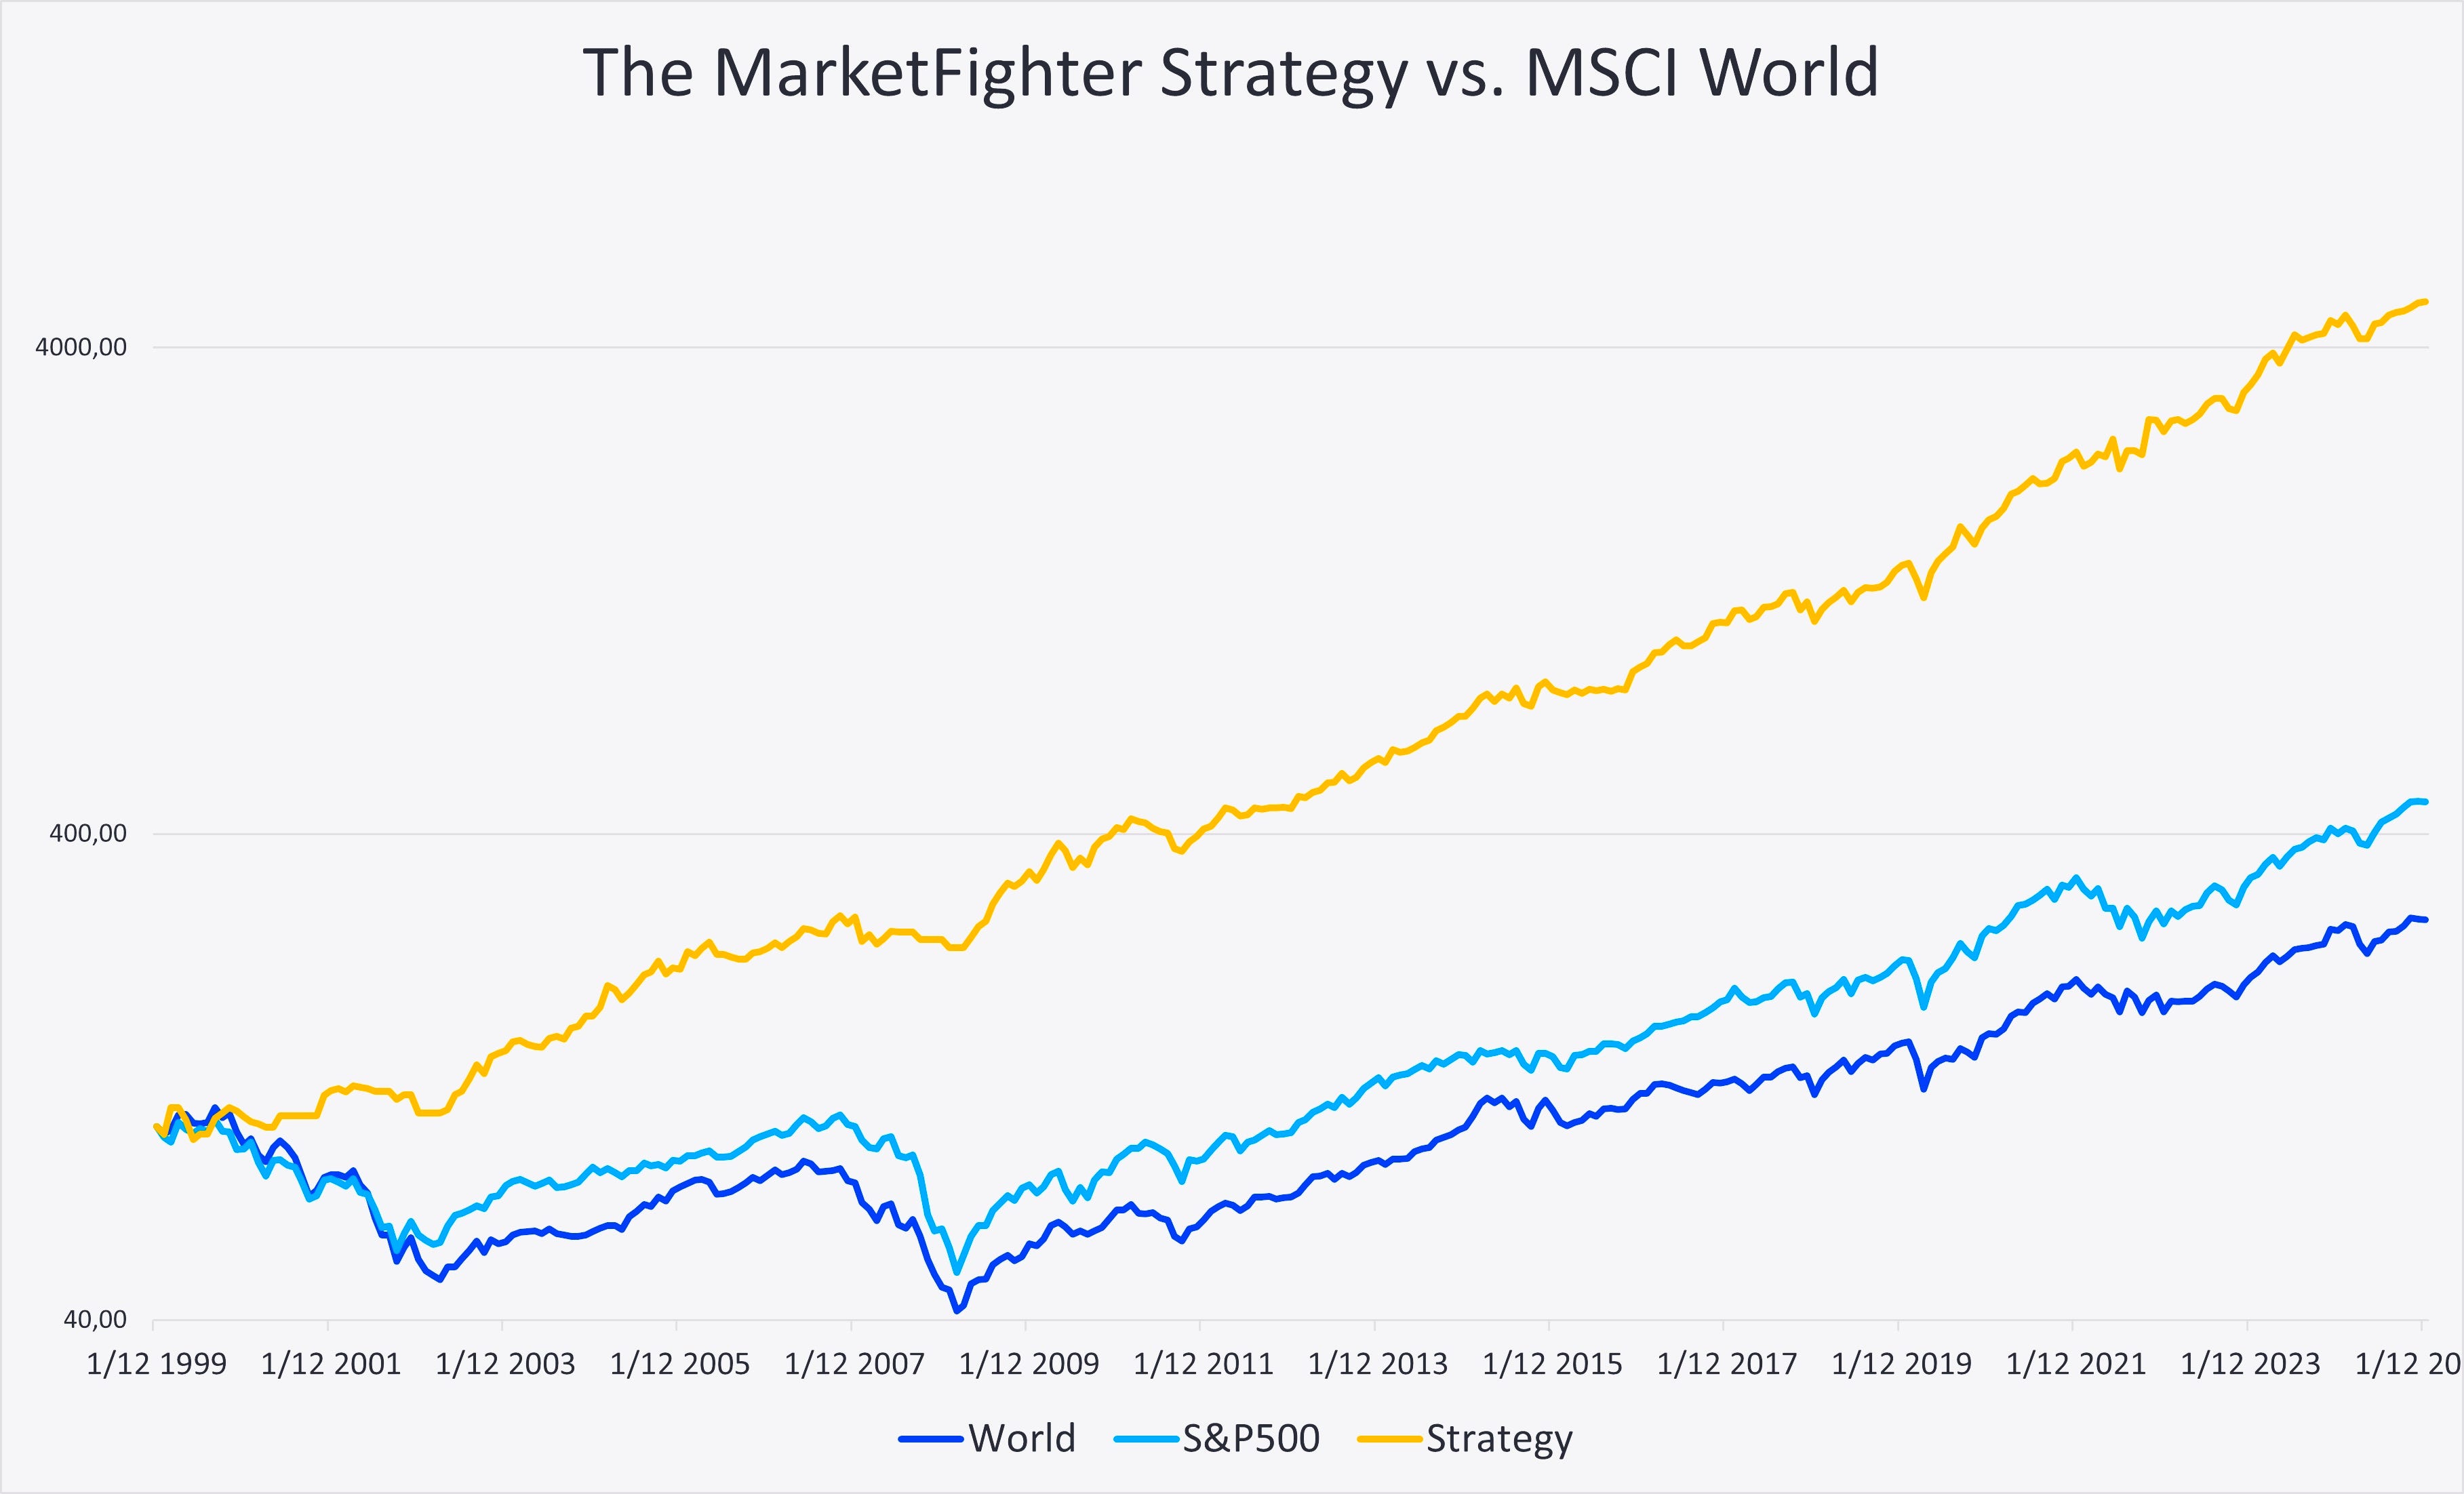
Finally I ended up with a chart like this, where the 2000-2020 period comes from back-tested results, while 2021-2025 is real data, where I actively traded the strategy:
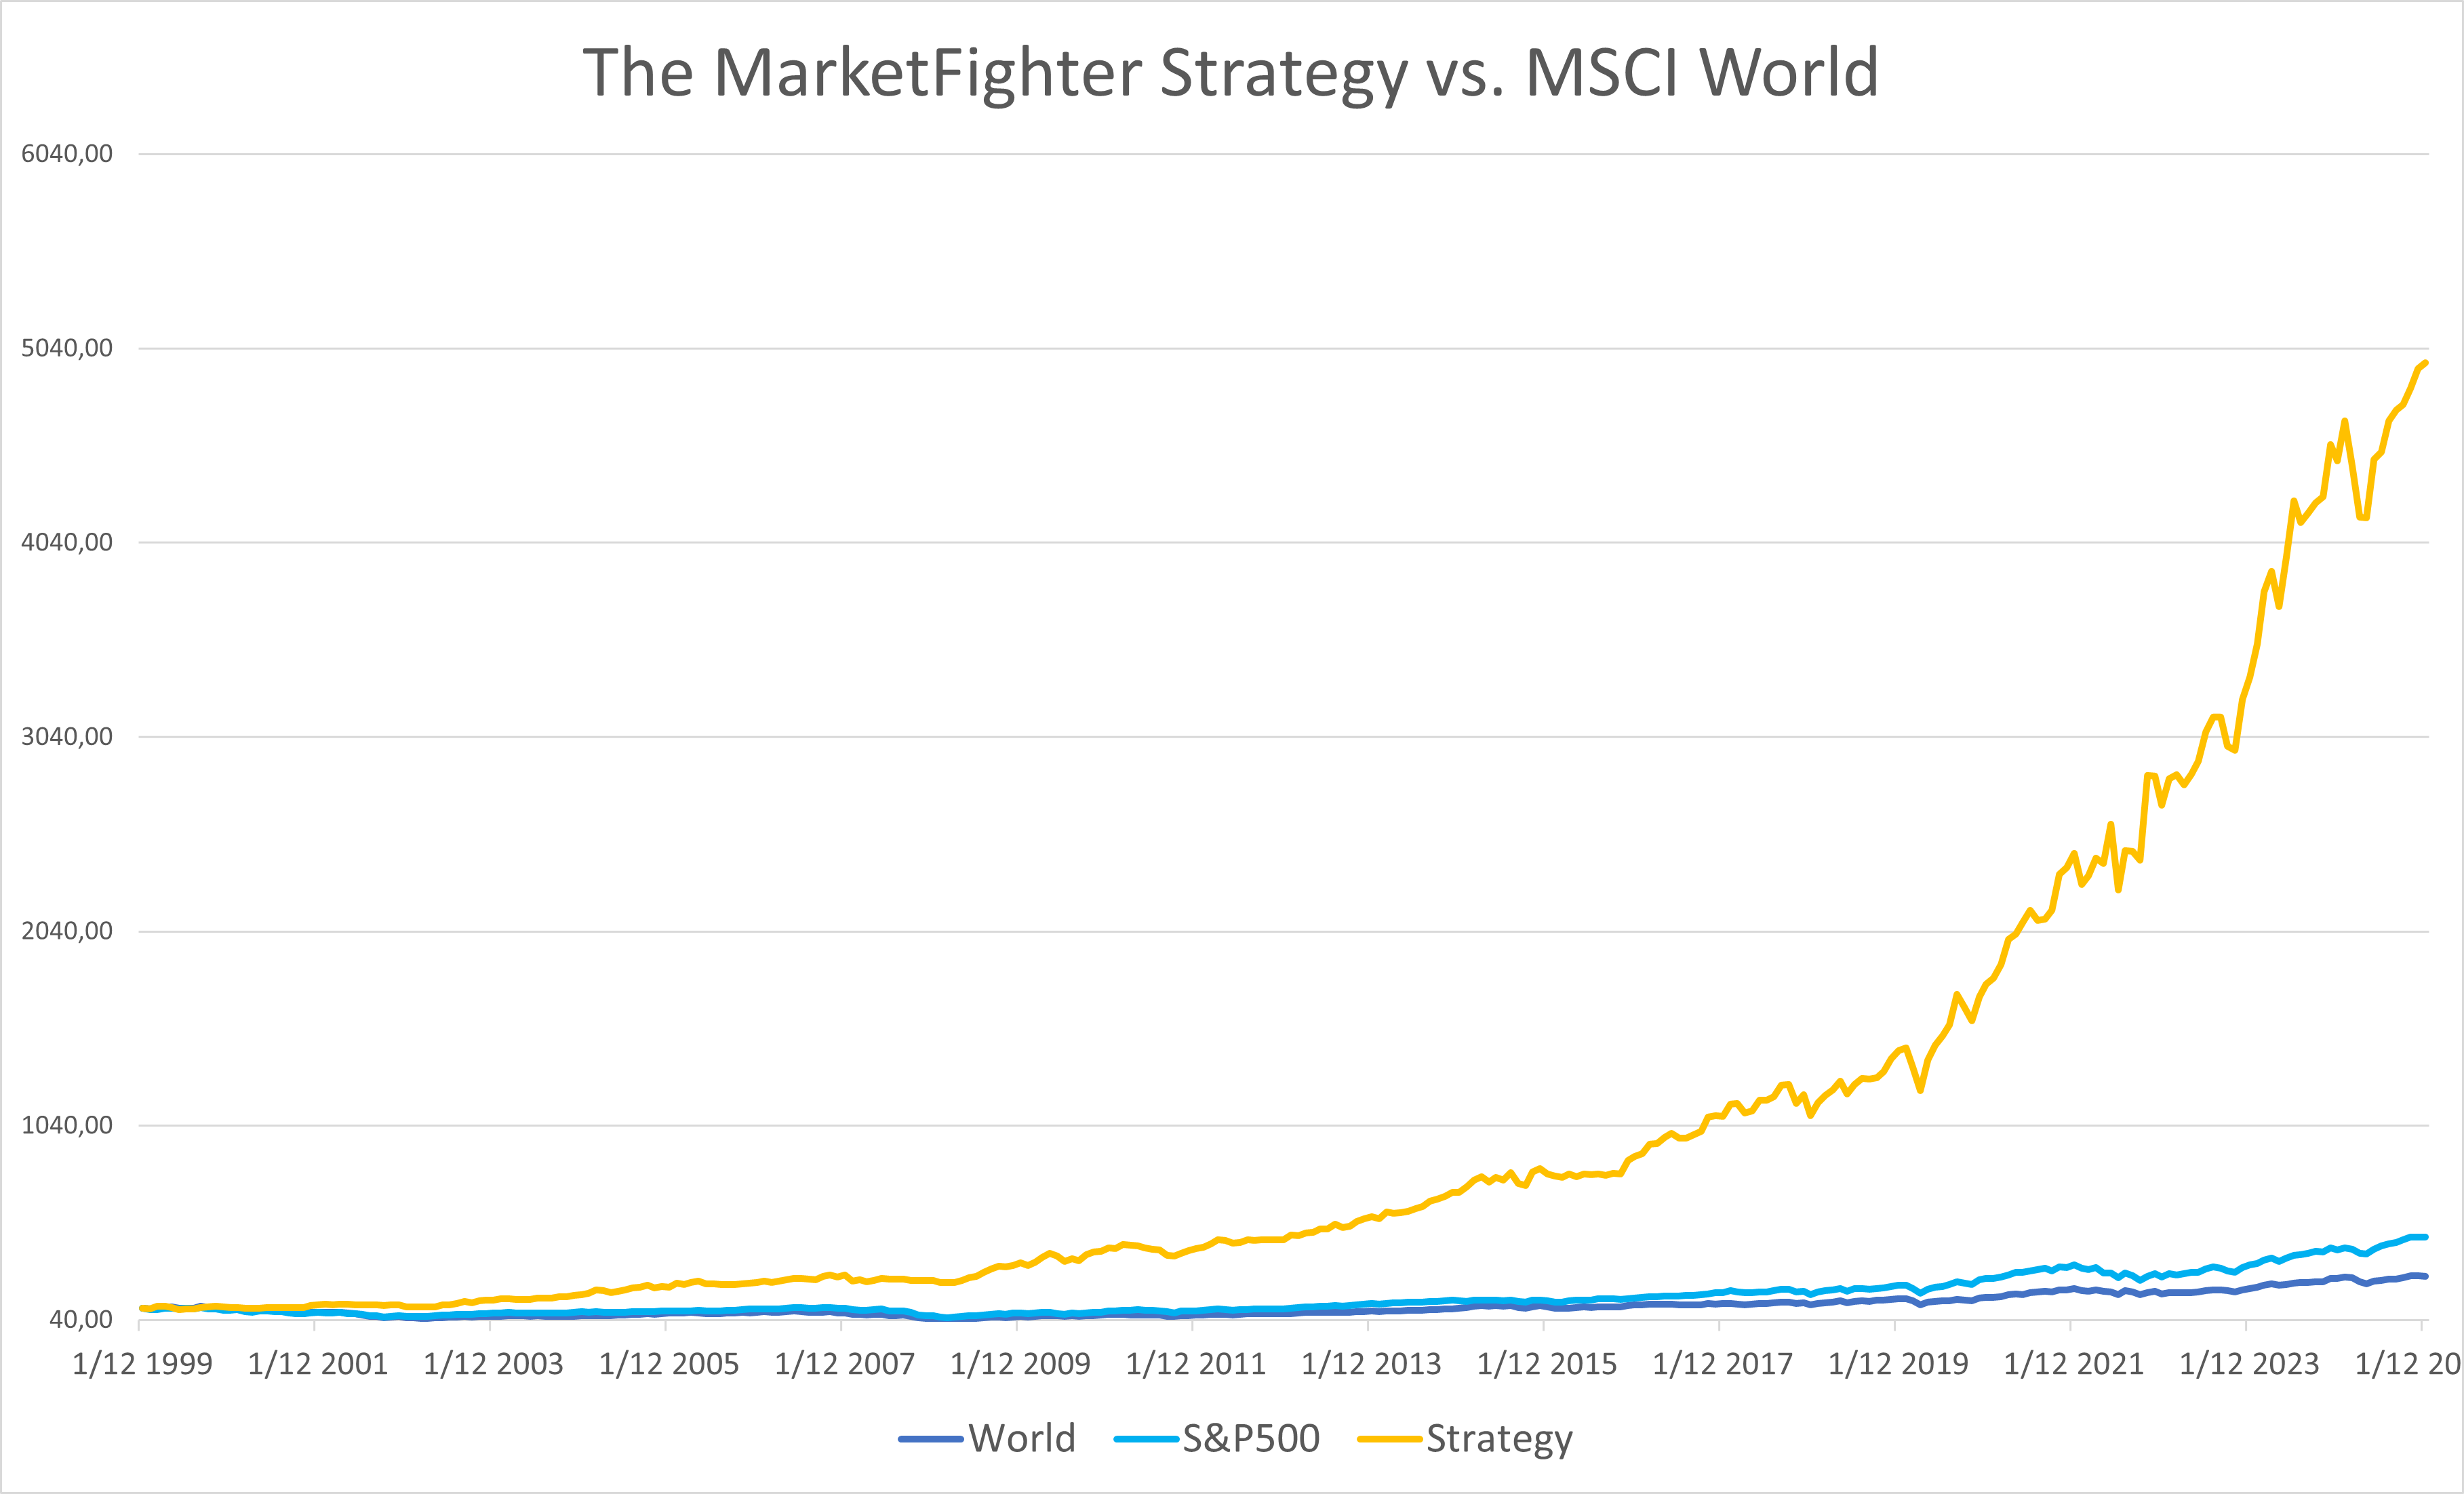
It looks almost absurd in a linear-scale chart on such a long timeframe. That’s the power of compounding that really kicks in, when applied over multiple decades, but it also illustrates the extreme long term potential of the system. Personally though, I prefer to look at long term charts using logarithmic scale, which allows me to see the fluctuations and linearity of the returns over time:
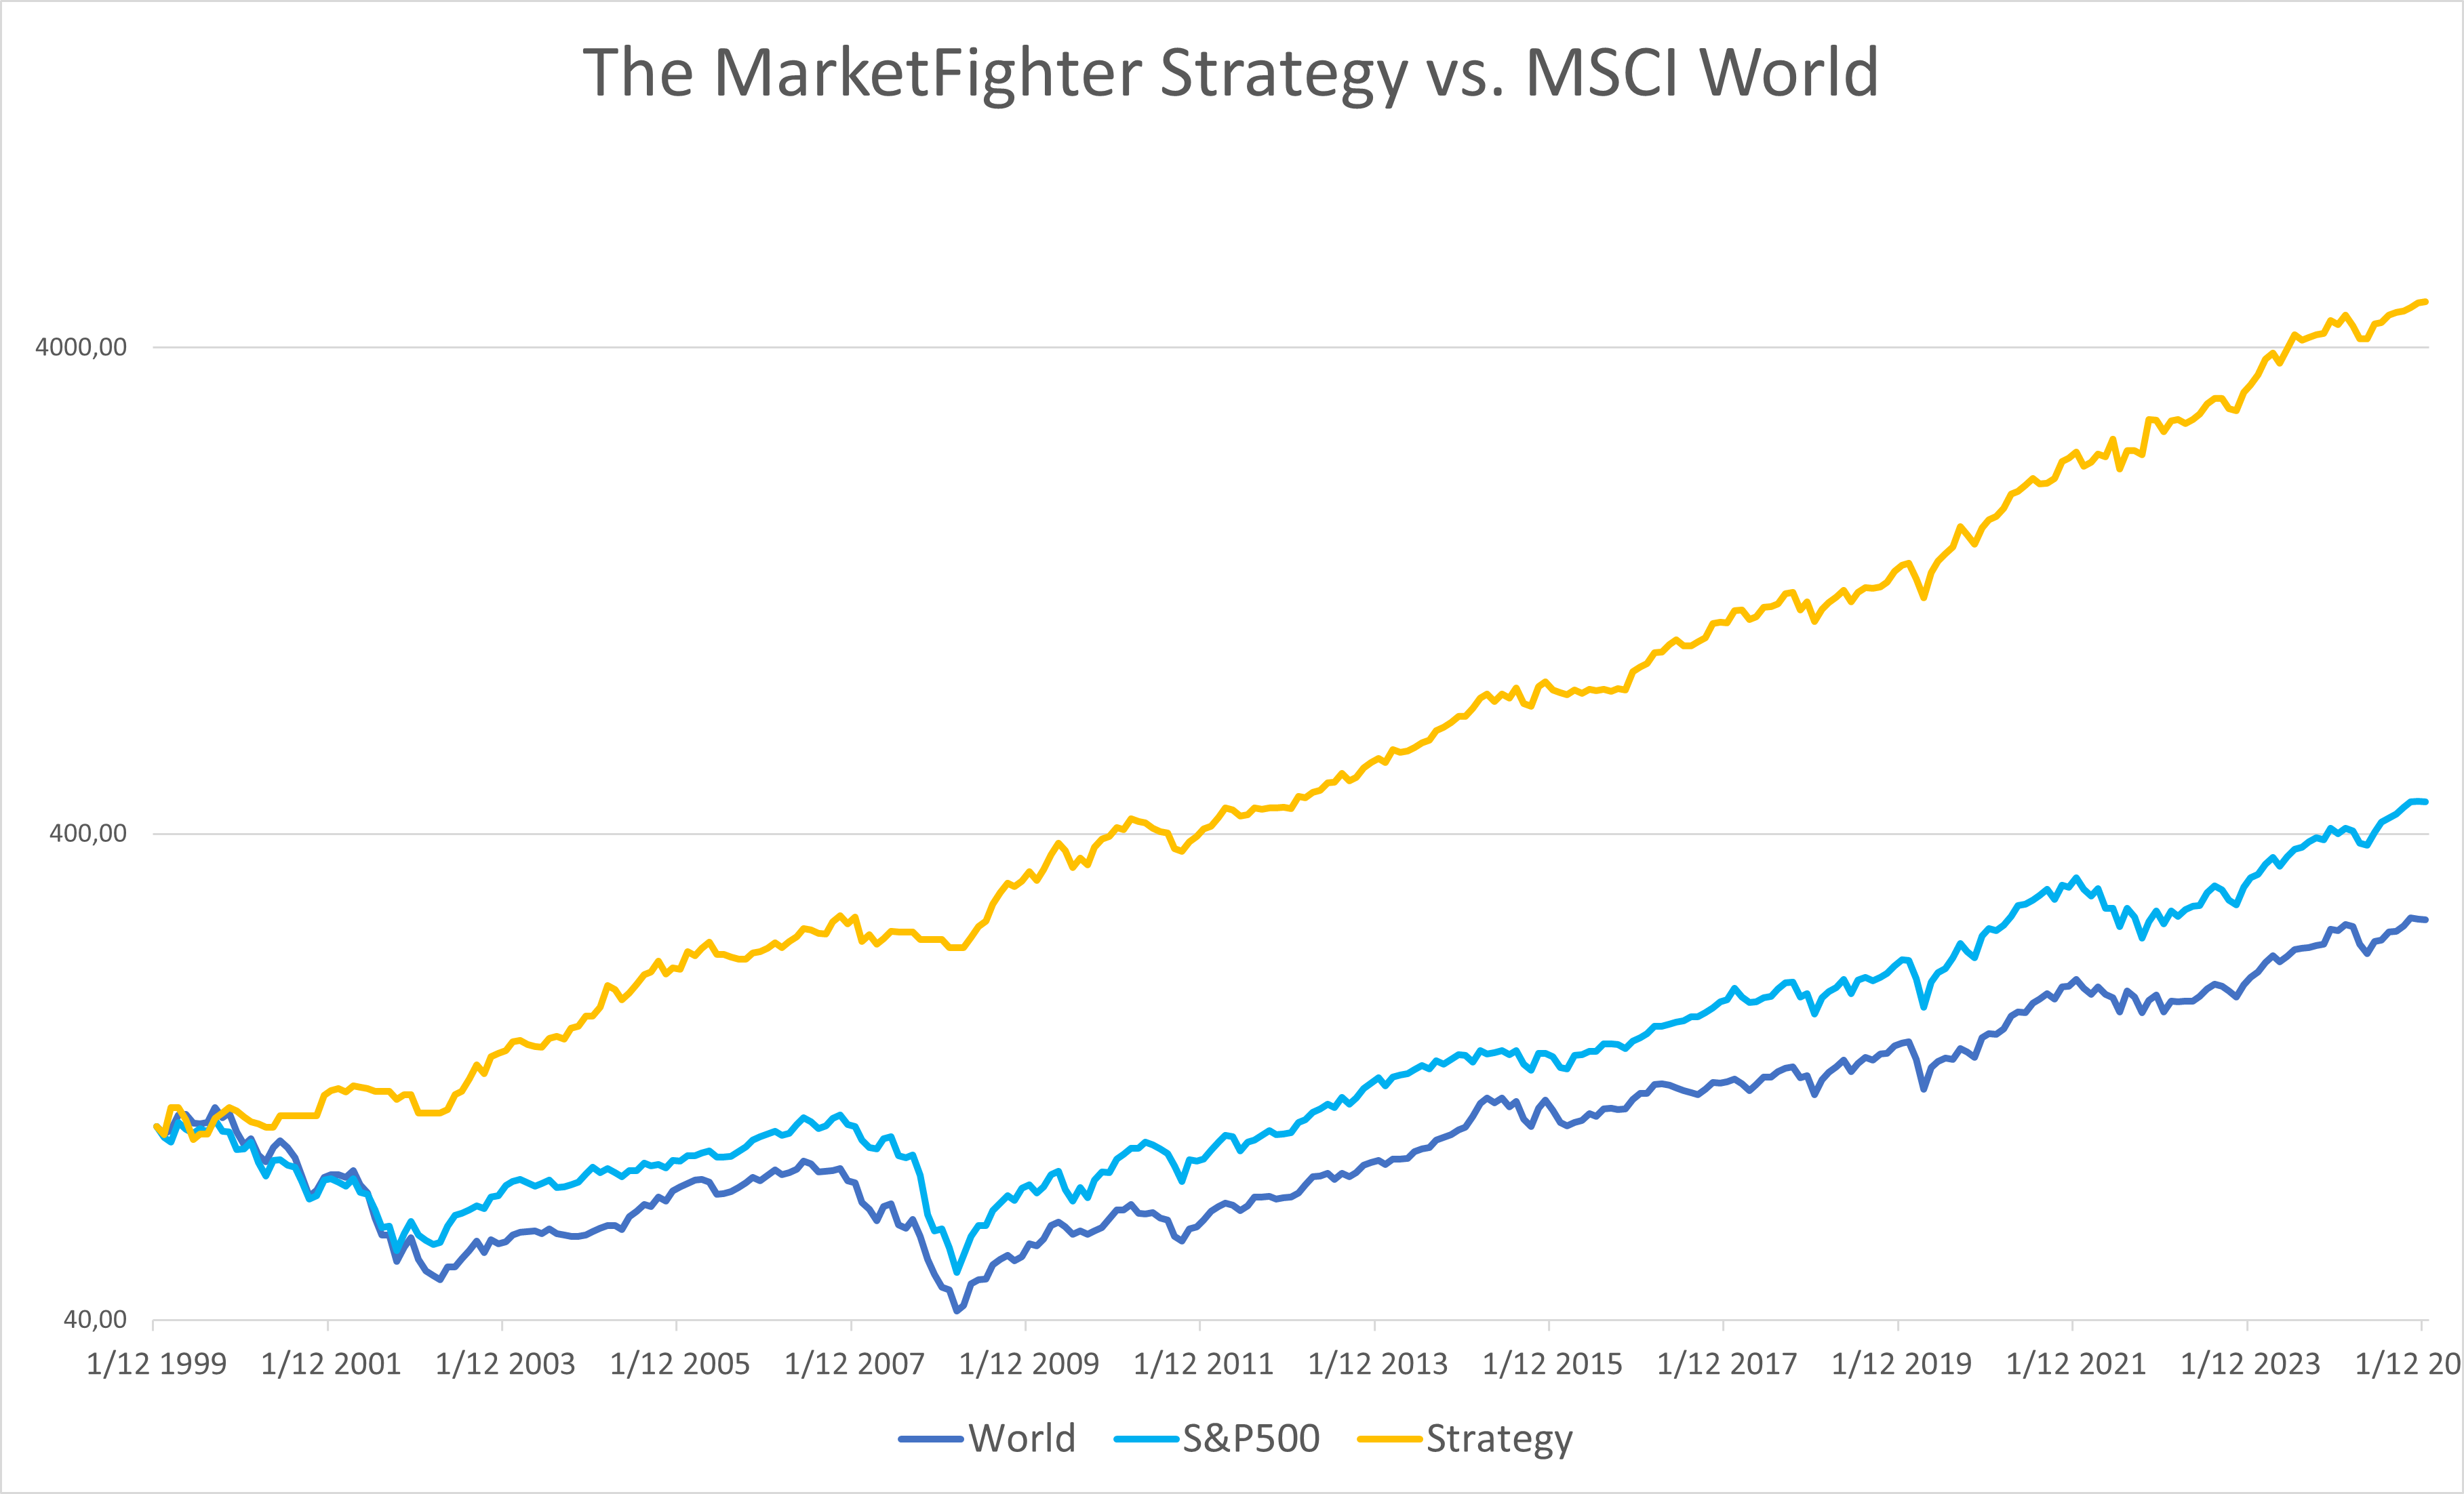
Notice the y-axis in this chart. Notice the nice linearity of the yellow line, representing the robustness and consistency of the combined strategy, which is remarkable compared to both the MSCI World Index and the S&P 500.
Distribution of returns
The performance and absolute returns of the strategy are excellent on their own, but where this strategy really shines is in its consistent distribution of returns and the absence of bad years. This illustration is at the core of the strategy. The part that gives me most confidence in bad periods. And the part that I’m most proud of:
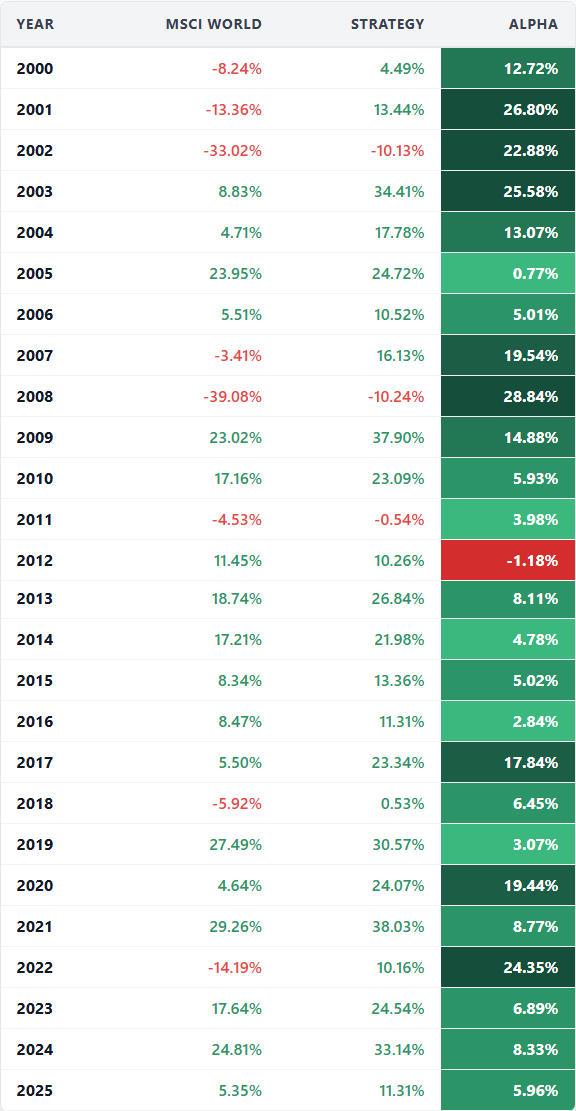
A few highlights are worth paying attention to:
The strategy beat the MSCI World Index in 25 of the 26 years where data exists
The worst year of relative performance was -1.18% compared to the index in 2012
The worst year of absolute performance was -10.24% during the GFC in 2008
It massively outperformed the index in bad market years like 2001, 2002, 2008 and 2022, which all resulted in alpha values above 20% for the strategy.
Performance data for the full period, 2000-2025:
Strategy CAGR: 16.21%
World Index CAGR: 3.84%
$1,000 invested in 2000 would now be worth $49,646
Be aware that this specific period is a bit special because it starts at the heights of the DotCom Bubble in 2000 - hence the very low CAGR for the World Index in the period.
Performance data for the last 10 years, 2016-2025:
Strategy CAGR: 20.16%
World Index CAGR: 9.44%
$1,000 invested 10 years ago would now be worth $6,274
The house always wins
Using the MarketFighter strategy I’m no longer trying to guess the market or acting on emotion. Instead I rely on data evidence and the statistical edge.
It has become a probability game, like in casinos where the house always wins in the long run. I feel like I’m the house now.
For five years I have invested most of my money using this strategy, and I’m planning to continue doing so for many years. Paid subscribers can now do the same by simply waiting for the monthly trading signals and invest accordingly. Be a MarketFighter.
Let me know your thoughts in the comments!
All numbers and performance metrics in this article are before taxes and trading fees, measured from a Euro-based investor perspective. The numbers are slightly different for a USD-based investor because of currency fluctuations, but the principles remain the same.
Disclaimer: The MarketFighter Strategy is for educational and informational purposes only. It is not financial advice, and the author is not a licensed investment advisor. Investing in ETFs involves significant risk, and past performance is never a guarantee of future results. You are solely responsible for your own trades and financial outcomes. Read the full Disclaimer here.
Great article on the power of combining factor investing with a systematic momentum overlay. It’s rare to see a strategy that effectively mitigates the decade-long underperformance periods often seen in pure factor plays.
Have you tested how sensitive the CAGR is to the specific look-back period—for instance, does using a 6-month vs. a 12-month momentum window significantly change the drawdown protection results?
You can feel the years of trial and patience behind this. The discipline to stick with a system is what most people struggle with. It’s a steady approach that seems to value consistency over excitement.