

Surviving market crashes is one of the hardest things in investing.
If markets simply gained 10% every year, investing would be easy. But few can handle the mental pressure of a long and deep bear market. That’s why most of us will do anything to limit our losses.
A lot of you have asked me about the drawdown protection layer of my ETF strategy. This simple mechanism would have prevented a large part of the drawdowns during the Great Financial Crisis and other historical bear markets.
I named this mechanism The Ketchup Rule, and you will soon understand why. In this post I will provide some answers and show how it would have performed historically, using backtested data.
While the details of the rule are proprietary to maintain the edge for members, I hope my research into 150 years of market crashes will be inspiring reading for every investor.
New to The MarketFighter Strategy?
I write about a simple approach to beat the stock market with only 15 minutes of monthly work that anyone can copy. Check out these links:
Market timing is impossible. Almost.
I’ve been investing and researching the stock market for more than 20 years. Anyone with just a little experience in this field has heard this saying over and over again:
Time in the market beats timing the market.
And to a large extent, I agree. There is a school of technical analysts and the like who attempt to predict future price movements based on various patterns, usually involving stop-loss mechanisms, but I have yet to see a consistently successful method.
So, as long-term investors, what can we do to limit the drawdowns?
When I finally adopted a more humble investing mindset, I started building an investment system consisting of the few factors I found to actually work with a satisfying level of consistency in my research.
Without getting into details, this was mainly rooted in momentum effects, quantitative factors, and rotational asset allocation. If you’re curious, you can read more about the system I built in this article.
But regardless of how much I improved historical average returns when backtesting these methods, I still faced the same problem: The long and deep drawdowns during bear markets were a mental killer.
The question remained: How do I get through the worst bear markets without panicking and feeling I’m losing everything?
My best solution
The system I eventually built was based on monthly closing prices. It turned out this data was just as useful for avoiding the worst parts of a bear market as it was for creating high-return systematic strategies.
Before I dig deeper into how it works, let me just show you the results of the solution I settled on. What you see below is a backtest using historical price data for the S&P 500 in a log-scale chart.
The blue line shows 150 years of price development for the S&P 500 (including its reconstructed historical index prior to 1957).
The orange line is the improved version using The Ketchup Rule. In 91% of the months it simply tracked the S&P 500. In the remaining 9% of the time it held cash.
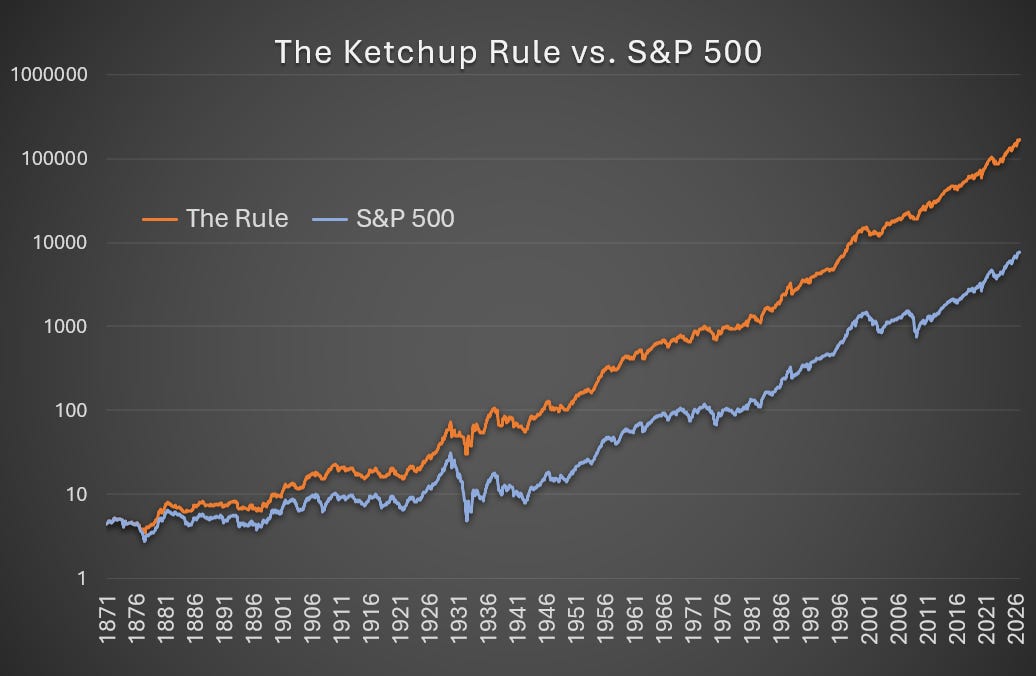
It may seem surprising that a strategy that simply switches between the index and cash can outperform the index in the long run. The explanation: Rather than predicting tops and bottoms, it acts as a circuit breaker using a fixed rule.
So, how does it decide when to switch to cash and when to enter the market again?
It’s surprisingly simple. It uses only one input: The monthly closing prices of the market index over the past 12 months.
It runs three checks on these numbers, and if all three fail, the system moves to cash. In any other case it stays fully invested.
I’ve used plain cash (with 0% gain) in all my data as a conservative assumption. In practice, the rule could also be implemented using T-bills, gold, or any other asset that doesn’t have a high correlation with stocks.
How I formed the backtest
At this point, the critical reader will point out that backtests are full of potential pitfalls and biases to be aware of, which is entirely true.
The worst of them all, if you ask me, is look-ahead bias, where decisions made at each historical moment have access to future data from the same dataset.
Here’s what I did:
At the start of each month, the algorithm only looked at the past 12 monthly closing prices. Yes, just these 12 values. No input from future data or from anything else.
Then I applied the three checks from The Ketchup Rule on these price values, and the output decides whether to invest or move to cash until the next monthly check.
That’s it.
Any ketchup coming out?
We all know this situation: A newly opened bottle of ketchup, and nothing is coming out even though we’re holding it upside down.
We knock on the bottom and watch the slow movements inside. Seconds feel like minutes. Slowly but surely the ketchup moves towards the exit, and all of a sudden… SPLASH!
This is how the worst and longest bear markets often turn out. The market declines for a while, gravity sets in, and finally panic spreads and everyone heads for the exit. This is what we call the capitulation phase.
Why does this happen so consistently? Because under the surface, market price action is driven by human psychology. Just as positive momentum drives speculative bubbles on the way up, negative momentum creates an emotional feedback loop on the way down, fueled by fear and loss aversion.
The Ketchup Rule works because it identifies when the negative momentum has built up to a level where a capitulation phase has historically become highly likely.
It’s not possible to predict or time the markets, but the situation described above is common to almost all of the long and steep declines we’ve seen in the past 150 years.
In fact, it was so consistent across multiple datasets that I decided to incorporate it into my systematic strategy.
As mentioned in the beginning, I generally don’t have much faith in market timing, and I don’t believe anything can be predicted (which is why I prefer to stay fully invested). But I found this effect to be so consistent in limiting losses from long bear markets that I didn’t want to miss out on it.
How it handled historical crashes
When I initially did the backtest and saw the patterns behind the pricing rules, my dataset covered price data from 1945 to 2020.
Later on, I extended my testing to other indices and to a longer history. This only confirmed the consistency, as The Ketchup Rule held up remarkably well, also on the out-of-sample data from before 1945.
In the following, I’ll give you an overview of the most critical bear markets in the last 150 years. The listings will show you:
The duration of the decline from peak to bottom.
The full duration from peak to new highs, using The Ketchup Rule.
The number of months spent in cash.
The drawdown when using the rule and for the S&P 500.
The return over the full duration, using the rule vs. the S&P 500 (measuring at the end of the month when the rule reached a new high).
An important note here is that this data is based on monthly closing prices only. This means drawdowns measured on a daily basis would most likely have been deeper, both with and without the rule.
Also, for regular readers, please be aware that these are not results of The MarketFighter Strategy. I use The Ketchup Rule as a core part of the strategy, but what you see below are results of this rule only.
The Panic of 1873, 1872-1879
Starting out with one of the longest bear markets in history, The Panic of 1873 resulted in 15 months in cash. When the drawdown strategy was finally back in positive territory after 88 months, the S&P 500 was still down 18.5%:
📉 Duration of decline: 61 months
📈 Total recovery time: 88 months
💰 Time in cash: 15 months
⤵️ Drawdown: -31.4% S&P: -47.3%
✅ Total return: +1.6% S&P: -18.5%
The Panic of 1907, 1906-1908
Also known as the Knickerbocker Crisis, this crash only took the drawdown strategy about half as far down as the S&P 500:
📉 Duration of decline: 14 months
📈 Total recovery time: 26 months
💰 Time in cash: 5 months
⤵️ Drawdown: -17.6% S&P: -33.8%
✅ Total return: +6.3% S&P: -11.9%
The Wall Street Crash, 1929-1932
The monumental crash that led to the Great Depression in the 1930s left the enhanced strategy with more than 2.5 times as much capital as the S&P 500:
📉 Duration of decline: 33 months
📈 Total recovery time: 74 months
💰 Time in cash: 21 months
⤵️ Drawdown: -58.8% S&P: -84.8%
✅ Total return: +6.9% S&P: -58.3%
The Oil Shock Bear Market, 1973-1974
In the 1970s, the oil crisis caused 17 months in cash during a long decline, in which the enhanced strategy came out roughly 15% ahead of the index:
📉 Duration of decline: 23 months
📈 Total recovery time: 67 months
💰 Time in cash: 17 months
⤵️ Drawdown: -32.2% S&P: -43.4%
✅ Total return: +1.3% S&P: -12.2%
Black Monday, 1987
On October 19th, 1987, the US stock market fell more than 20% in a single day. Due to the pace of this event, the rule didn’t catch it, and it fell with the index. The full decline lasted 4 months, and due to 1 month in cash, the strategy still reached a new high before the S&P 500 did:
📉 Duration of decline: 4 months
📈 Total recovery time: 22 months
💰 Time in cash: 1 month
⤵️ Drawdown: -26.8% S&P: -26.8%
✅ Total return: +0.8% S&P: -1.7%
The Dot-Com Bubble, 2000-2002
The big tech crash in the early 2000s caused 13 months in cash and left the strategy with a drawdown only half as bad as the S&P 500:
📉 Duration of decline: 25 months
📈 Total recovery time: 38 months
💰 Time in cash: 13 months
⤵️ Drawdown: -21.4% S&P: -43.7%
✅ Total return: +1.4% S&P: -30.1%
The Great Financial Crisis, 2007-2009
As the worst crash since 1929, the GFC was another great test for The Ketchup Rule, resulting in a drawdown of -17.3%, while the index itself was cut in half. The strategy came out roughly 50% ahead as it reached a new high as early as 2009:
📉 Duration of decline: 17 months
📈 Total recovery time: 23 months
💰 Time in cash: 9 months
⤵️ Drawdown: -17.3% S&P: -50.8%
✅ Total return: +1.9% S&P: -32.2%
The COVID-19 Crash, 2020
Just like the 1987 crash, the COVID-19 crash happened so fast that the rule didn’t kick in. And in both cases, this was a good thing, because an exit would have caused a huge lag during the quick V-shaped recovery that followed.
📉 Duration of decline: 2 months
📈 Total recovery time: 7 months
💰 Time in cash: 0 months
⤵️ Drawdown: -19.1% S&P: -19.1%
✅ Total return: +3.4% S&P: +3.4%
I could have included the 2022 bear market here, but despite being fresh in many people’s memory, it was a significantly milder decline than any of the major historical crashes listed above. The Ketchup Rule came close to triggering an exit, but it held through the full drawdown and came out equal to the market.
There are no miracles
To avoid misunderstandings, I want to briefly discuss what this is and what it’s not. First of all, it’s a strategy that can potentially take out the worst parts of severe market crashes using simple rules.
As you saw in the numbers above, it held up quite well during the worst bear markets. At the same time though, we should keep in mind that:
It won’t eliminate drawdowns.
It won’t exit during the early phases of a bear market.
It won’t protect against flash crashes (like 1987 and 2020).
We don’t know if it will continue to work in the future.
To be transparent and also show when it didn’t work well, here’s a Top 5 of the worst losses the rule suffered across the whole dataset. This happened when the market rose while the rule was in cash.
Top 5 Worst Relative Losses
1️⃣ -7.6% in 1975
2️⃣ -6.6% in 1893
3️⃣ -4.8% in 1882
4️⃣ -4.2% in 1877
5️⃣ -4.1% in 1974
Most of these relative losses occurred during bear markets where the rule still came out ahead overall.
Take this for what it is. For me, it’s the most consistent bear market protection I’ve seen, working with as few false alarms as possible. I’d rather take part of the drawdown than miss the recovery or get caught in frequent false alarms.
The chart earlier in this article shows the full picture with all the good and the bad phases over the past 150 years.
Average annual return (CAGR) 1871-2026
🟠 The Ketchup Rule: 10.9%
🔵 S&P 500: 9.0%
How I use The Ketchup Rule
This rule could be added to any other strategy as a means to protect against severe market crashes. I run The MarketFighter Strategy, which consists of three parts:
The Ketchup Rule
Sector rotation using relative momentum
Factor rotation using relative momentum
Once a month, when the closing prices are in, I check all three of them. If The Ketchup Rule triggers, I sell. Otherwise I buy the two ETFs my system picks (#2 and #3). The time between the monthly checks is a freeze period, in which I never do any trading, no matter what happens.
While most of my own capital is invested using this strategy, I own some individual stocks as well in a smaller portfolio. When The Ketchup Rule triggers, I may sell a few of these names as well to limit losses.
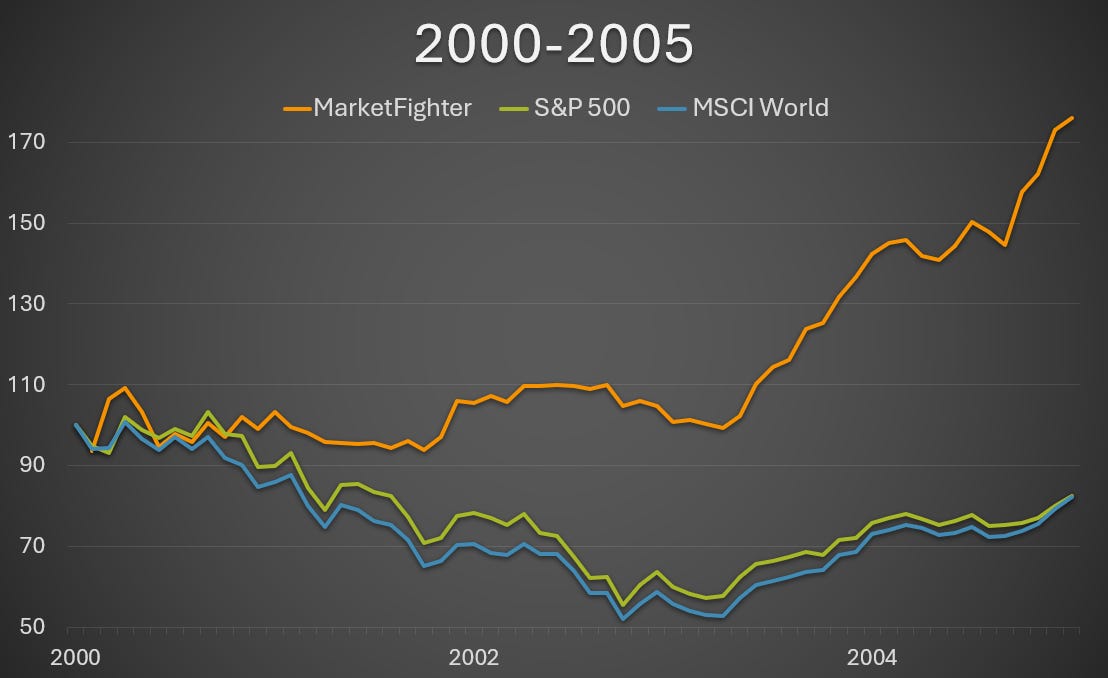
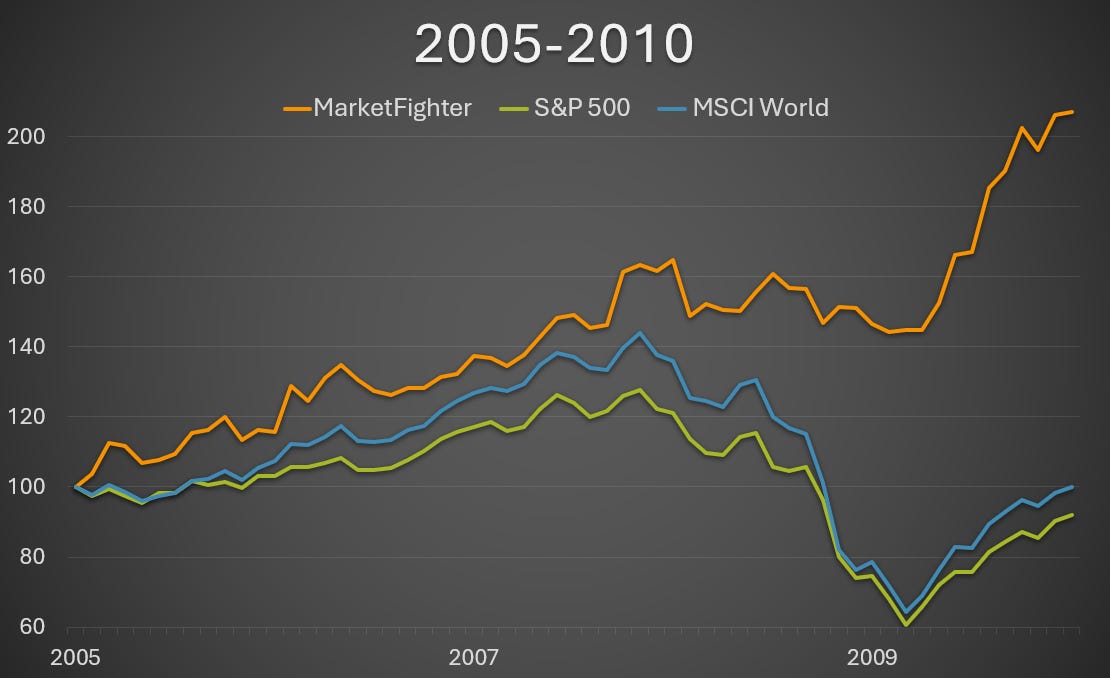
As mentioned, the rule can be applied as an add-on to any other strategy. For inspiration, the two charts below show how The MarketFighter Strategy would have managed The Dot-Com Bubble in 2000-2002 and The Great Financial Crisis in 2007-2009, using the combined logic of the three parts above.
An important reminder
While I’ve been following this approach with my own money since March 2021, I have yet to experience a move to cash myself.
The Ketchup Rule hasn’t triggered a move to cash since 2008-2009. You could say it has done a great job in not moving to cash during my five years of executing the strategy, but I still have limited out-of-sample data on this.
As always, remember that past performance is not a guarantee of future returns. Personally, I find value in consistently good past performance, and I believe this increases my chances of success, but nothing is ever guaranteed in finance.
I hope you found this article inspiring. If you’re interested in more data-driven market research and strategic insights, you can subscribe for free.
If you want full access to The MarketFighter Strategy and the monthly trading signals (including those from The Ketchup Rule), simply become a paid subscriber and join our growing community.
Thank you for reading!
Disclaimer: The MarketFighter Strategy is for educational and informational purposes only. It is not financial advice, and the author is not a licensed investment advisor. Investing in ETFs involves significant risk, and past performance is never a guarantee of future results. You are solely responsible for your own trades and financial outcomes. Read the full Disclaimer here.