
How I Systematically Beat the S&P 500 (And Now You Can Access the Full Strategy)
A transparent, data-driven look at how a simple ETF rotation model stacks up against the world's hardest benchmark to beat.


Dear friends 👋
The MarketFighter Strategy has officially transitioned into a premium service for serious long-term investors.
To ensure full transparency for those considering a paid subscription, I wanted to tackle the ultimate question: How does this system hold up against the S&P 500?
New to The MarketFighter Strategy?
I write about a simple approach to beat the stock market with only 15 minutes of monthly work that anyone can copy. Check out these links:
How does it compare to the S&P 500?
As a global investor living in Europe, I’m used to comparing everything against the MSCI World Index. It’s the closest match to the universe of stocks my strategy is exposed to across Europe and the US.
But I acknowledge that for investors living in the US, the common benchmark for all stock investing is the S&P 500, even though it only covers US-listed stocks.
It’s also worth noting that since 2010, the S&P 500 has significantly outperformed the MSCI World Index, mainly because of the Magnificent Seven stocks.
In this post, I have prepared a fully transparent comparison between my strategy and the S&P 500.
Comparing 1-year intervals
First, let’s take a look at the total return percentage generated by the strategy vs. the S&P 500 down to each individual calendar year:
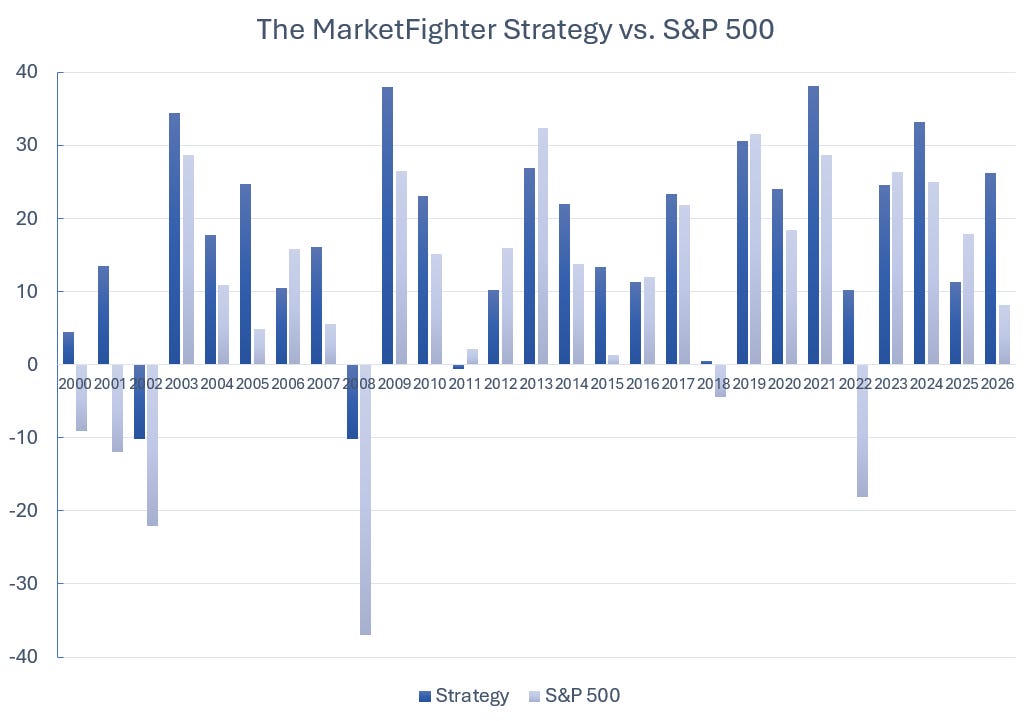
The numbers in the chart do not account for taxes or trading fees, and they’re measured in local currencies. This means you will see different returns depending on your own currency.
As the chart shows, the strategy beats the S&P 500 in most years, but not in all years. In years where the S&P 500 is negative, the strategy tends to be significantly stronger (2000-2002, 2008, 2018, and 2022).
But I realized a bar chart with 54 bars may not be the best way to get an overview, and I did not develop this strategy to trade it for a single year anyway.
Comparing 3-year intervals
In the chart below, I have clustered the same data into 3-year intervals across the full period of my backtest (2000-2020) and the years I have actively traded it (2021-2026):
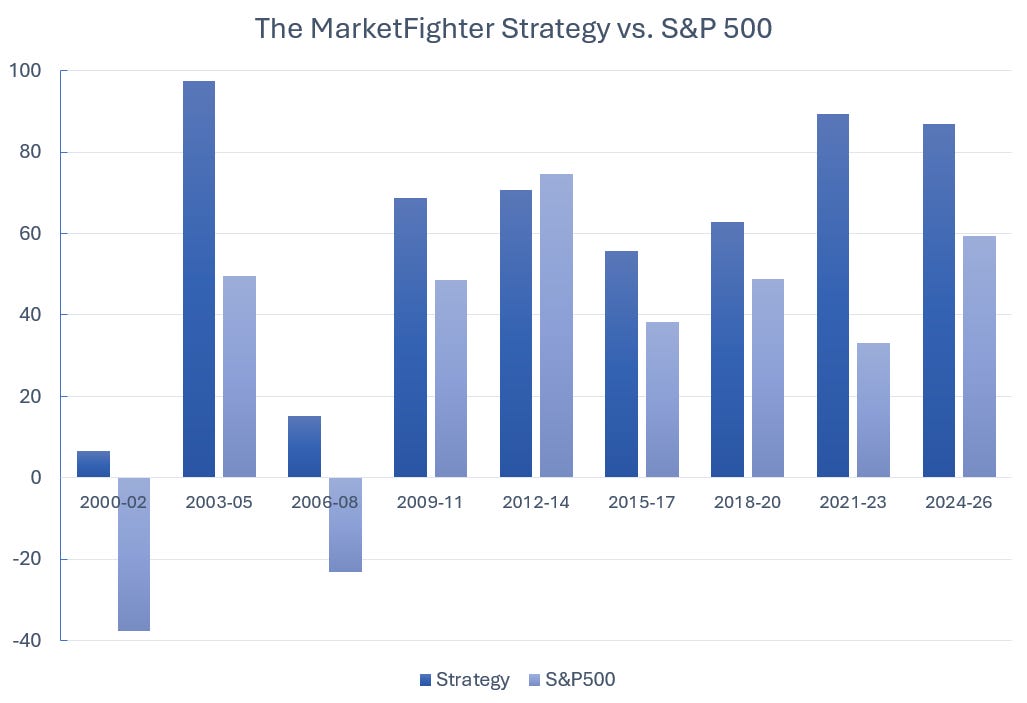
Now the long-term consistency shows. The strategy has outperformed the S&P 500 in all of the 3-year intervals of this century except one. Only in the 2012-2014 interval, where the momentum effect struggled, did the strategy slightly lag the index.
I had never done this comparison until I did the research for this article. In all of my backtesting and data checking, I had always been comparing to MSCI World, because it makes more sense to me as an investor living in Europe and trading both US and European stocks.
Seeing how well the system has actually performed for long-term investing against “the hardest benchmark to beat” is incredibly reassuring.
I’m also pleased to notice that the level of outperformance I found in the backtests has not decreased since I started trading it in 2021. Rather the opposite, but that probably comes down to randomness.
Developing backtests for trading strategies is a minefield of pitfalls and risks like overfitting, forward-looking bias, and survivorship bias.
Awareness of these helps a lot, but the only true measure of success is the performance measured after the backtest was executed and the strategy went live (known as out-of-sample data).
Read more about my backtest and how I developed the strategy in this post.
Coming up on MarketFighter
I’m receiving a lot of questions and ideas from both new and existing subscribers, and it’s amazing to feel the engagement of this growing community!
This is a great source of inspiration for future articles I will be writing over the coming months, including themes like:
How to stay disciplined and stick to a strategy
Crashes and how to protect against the deepest declines
Full historical monthly return breakdown of the strategy
The strategy from a US and Dollar perspective
What research says about market returns
How to handle the emotional and psychological side of investing
Life after quitting the 9-to-5 job
These educational articles and insights will remain open for everyone, while only paid subscribers will get access to the monthly trading signals.
The paid tier is waiting for you
Dozens of serious investors have already upgraded to the paid subscription and are now tracking the strategy.
If you want to continue having full access to the strategy and the monthly trading signals, don’t forget to upgrade.
▶️ Monthly Subscription: $45/month
⏩ Annual Subscription: $375/year
Thanks for reading!
Disclaimer: The MarketFighter Strategy is for educational and informational purposes only. It is not financial advice, and the author is not a licensed investment advisor. Investing in ETFs involves significant risk, and past performance is never a guarantee of future results. You are solely responsible for your own trades and financial outcomes. Read the full Disclaimer here.
One thing I've learned is that a strategy's biggest challenge usually isn't generating returns- it's surviving the periods when it underperforms and investors abandon it at exactly the wrong time.
When first funding/adding funds to this strategy, do you recommend waiting for the start of a new month or is it ok to enter mid-cycle?