
Performance Update: July 2026
Quietly outperforming the market by 11.04% in 2026 YTD. See how The MarketFighter Strategy compares to the market month by month.


I start every month by sending out a performance update for subscribers to The MarketFighter Strategy: the investment approach I have followed for the past five years, which I’m sharing in this newsletter. It’s a strategy that beat the market in most years since 2000.
In this post, I will give you a transparent look into how the strategy performed in June and how far we are ahead of the market in 2026 so far.
New to The MarketFighter Strategy?
I write about a simple approach to beat the stock market with only 15 minutes of monthly work that anyone can copy. Check out these links:
First negative month in 2026
The strategy has had a great run in 2026, holding out until June before registering its first negative month. While the loss itself was small, it was a loss in both absolute terms and relative to market benchmarks.
The chart below shows the performance of the strategy (blue) compared to the MSCI World Index (gray) month by month:
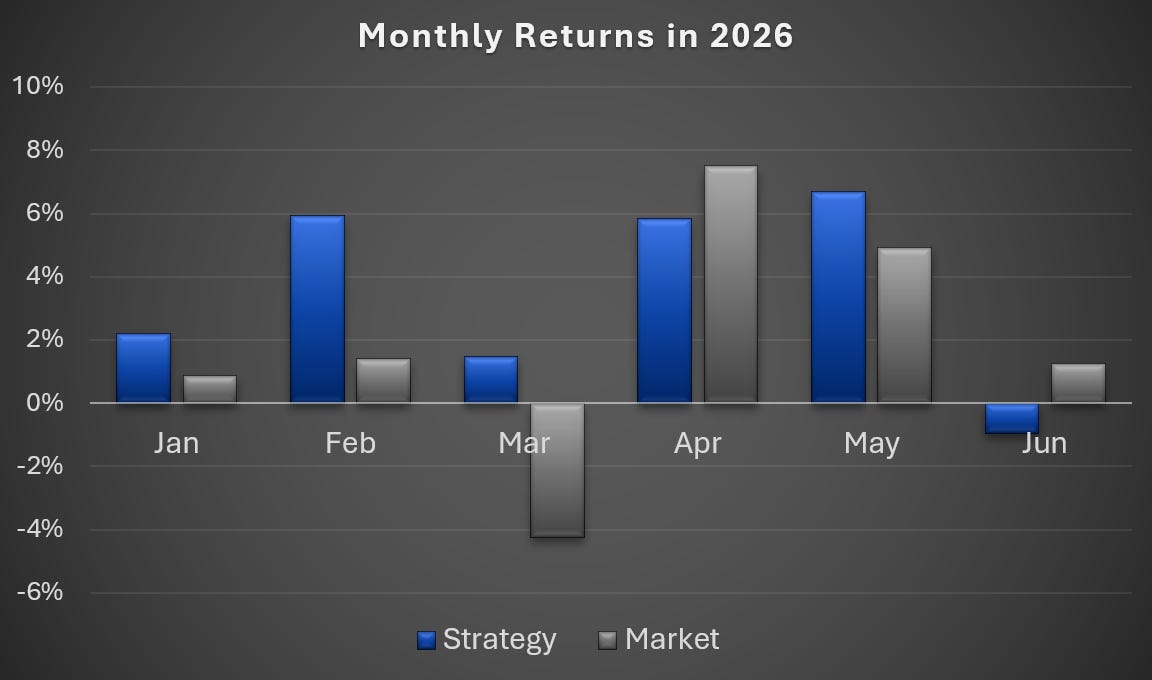
For a long-term investment strategy, one month is an extremely short time frame. Historically, this strategy underperforms the market in 30% to 40% of the months. On a yearly basis, the numbers are closer to 5% to 25% depending on the timeframe and the benchmark.
Does this negative month impact me in any way? Absolutely not. I have experienced it over and over again. Outperformance tends to show up as a reward for patience and long-term thinking.
ETF allocations in June
🌍 Factor ETF: US Value
🏢 Sector ETF: Energy Sector
The allocations of the system in June were identical to May, and so was the overall story of the month: while US Value outperformed the market (driven by Micron, among other names), the Energy Sector did the opposite.
But while the balance between them resulted in outperformance in May, their combined effect led to underperformance in June. One good takeaway from this is that I once again experienced a diversification benefit from following a two-legged strategy.
Allocations for July
If you’re looking for the new July trading signal and curious about which ETFs the strategy is currently allocated to, it’s in a separate post here:
The monthly breakdown
In the table below, I have provided the exact performance of the strategy on a monthly basis compared to the market (the MSCI World Index), as well as the alpha (the difference between our return and the market return):
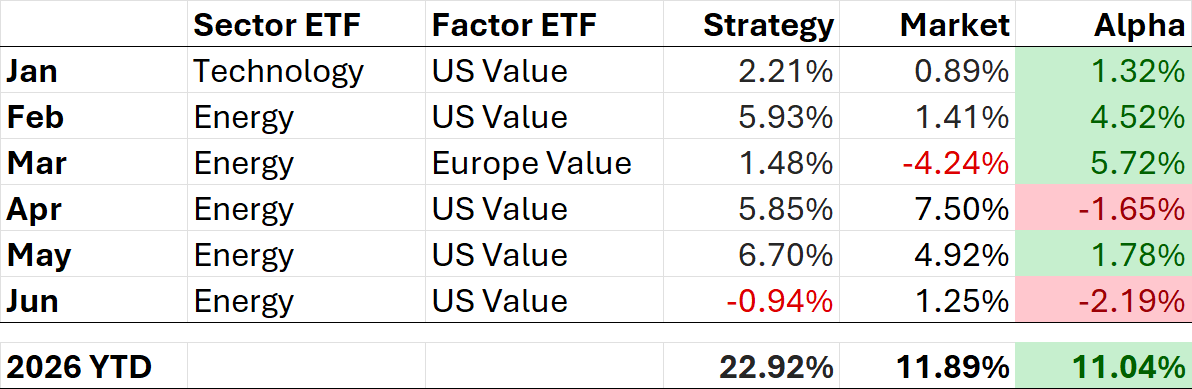
The table also shows the allocation in each month. These are the two ETFs the system decided to hold based on the relative price momentum rules that form the strategy.
Despite lagging the MSCI World in June, the strategy is still 11.04% ahead of the index year-to-date. Compared to the S&P 500, that number is 12.94% (not accounting for currency fluctuations).
It can be tempting to try to predict the relative performance of the coming months based on the recent data. But I must say, I have found no predictive value in how the strategy performs relative to the market. This means:
This month’s underperformance neither increases nor decreases the probability of underperformance in the coming month.
This first half-year’s outperformance neither increases nor decreases the probability of outperformance for the rest of the year.
Personally, this makes me calm, and it means I won’t spend my time worrying about what will and will not happen.
This is one of the benefits of a systematic approach. I don’t need to know what will happen next month, but I have a well-grounded expectation for the long term. I simply stick to my strategy, as I have done consistently since early 2021.
➡️ See this article for the full return overview of each year
You can read more about the full investment universe and the 15 indices and corresponding ETFs the strategy uses here:
The international challenge
I’m increasingly proud of, and excited about, the growing community of international investors following my newsletter. Your trust and support mean the world to me.
I’m also quietly learning that a global audience is difficult to fit into one box, and I’m still working on ways to improve the diversification of my output, while maintaining its simplicity. The biggest challenges are:
Currency
A person who tracks this strategy in US dollars, British pounds, or Australian dollars, will experience different returns than what I’m presenting in Euros.Indices
A lot of people, particularly in the US, are used to benchmarking all stock market performance against the S&P 500, while in Europe we tend to use the MSCI World Index.ETF implementations
Due to local regulation, particularly in the European Union, retail investors across the globe don’t have access to trade the same ETFs.Taxing
Every country has its own tax rules. Tax is an important topic, also for me, but I am not an expert in tax in other countries than Denmark where I live.
Consequently, I cannot display numbers that will fit everyone perfectly in these reports. What you see are the raw underlying index returns, measured in Euro and not accounting for potential taxes or other fees.
To illustrate one example of movements that affect the returns in good or bad direction, here’s the effect of currency changes between USD and EUR by month:
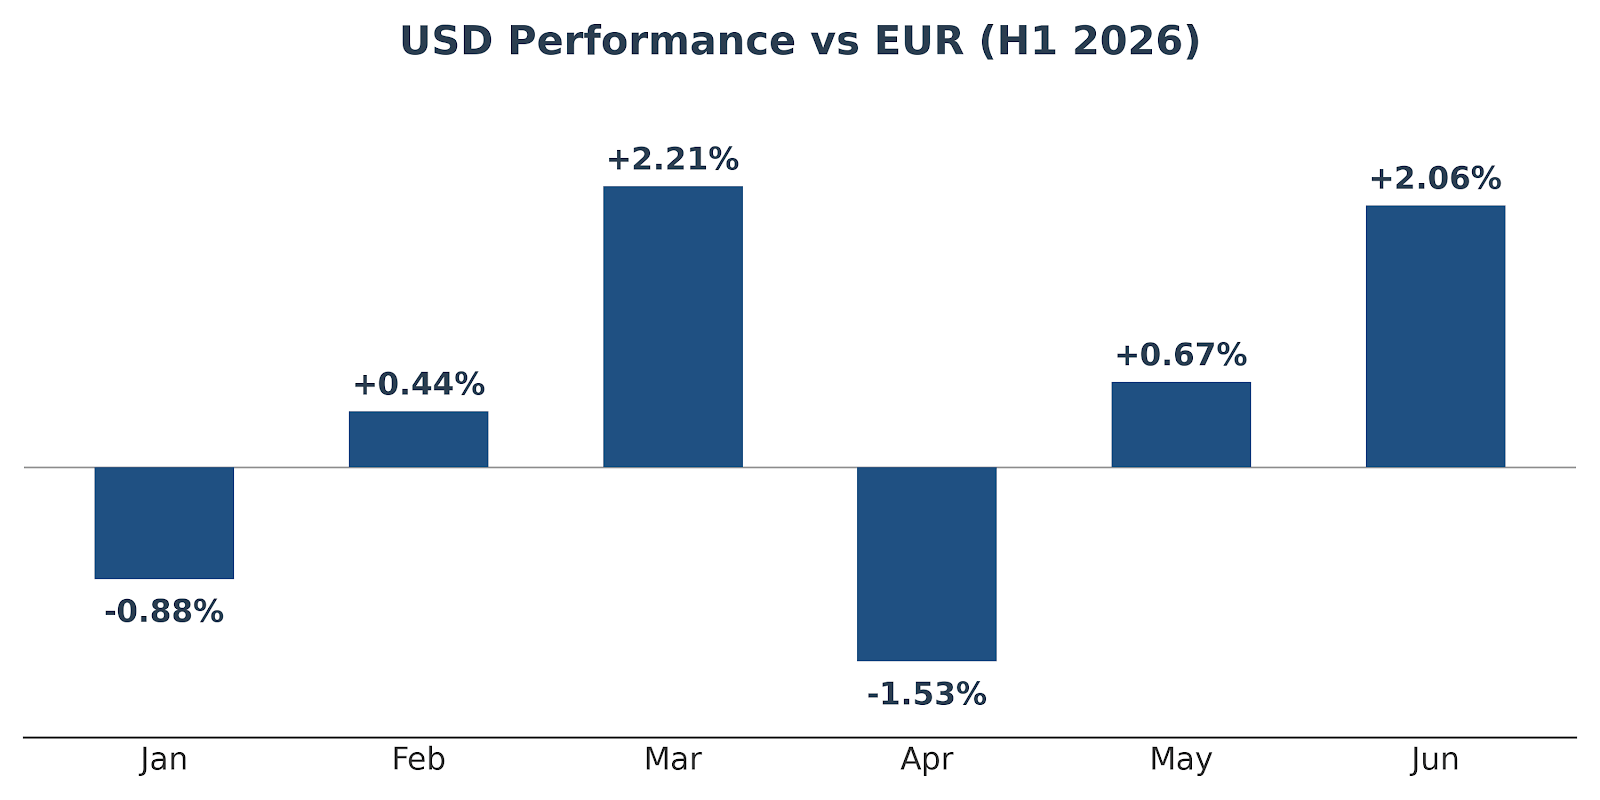
The takeaway is: if you were investing from a EUR-based account, you would have achieved a return 2.06% higher than someone trading the same ETFs from a USD-based account in June.
I am, however, starting to think about a potential solution to this challenge of displaying multiple variations of results. Hopefully I can give you some good news within a few months. Stay tuned.
If you found this post interesting, and you’re not part of the journey yet, don’t forget to subscribe. I provide a number of free articles every month along with the trading signals for a growing community of MarketFighters.
Thanks for reading!
Disclaimer: The MarketFighter Strategy is for educational and informational purposes only. It is not financial advice, and the author is not a licensed investment advisor. Investing in ETFs involves significant risk, and past performance is never a guarantee of future results. You are solely responsible for your own trades and financial outcomes. Read the full Disclaimer here.