


Hi friend 👋
Welcome to the updated monthly performance report for The MarketFighter Strategy. This is the simple rules-based strategy I’ve been following for more than five years and share with subscribers in this newsletter.
The past month did not deliver the outperformance we’ve seen earlier this year. Actually, it was quite the opposite, and not by a small margin.
For many readers, especially those who joined recently, this was a new experience. For me, it was simply one of the bad months that occur almost every year.
The strategy is still ahead of both benchmarks, and in 7 of the last 8 years it had worse months than this, while still outperforming the S&P 500 for the full year.
Hundreds of paid subscribers are already following along, and I’m very pleased to welcome every new MarketFighter to this little community. Thanks everyone!
New to The MarketFighter Strategy?
I write about a simple approach to beat the stock market with only 15 minutes of monthly work that anyone can copy. Check out these links:
October was a step back
Right from the beginning I decided on an open and transparent approach to performance numbers. This is not going to change, and I want to be straightforward about the past month: It wasn’t fun.
The strategy experienced its worst loss since March 2025, with a decline of 3.5% measured in EUR. This number was even aided by a weak EUR vs. USD. For followers in non-EUR countries like the US, the UK and Canada, the combined loss was even steeper.
Declines like this are a normal part of the strategy. Even after October, it’s still ahead of the market this year by more than its average annual outperformance, as you will see in the charts below.
The S&P 500 lost 0.9% during October, while the MSCI World Index (EUR) registered a gain of 0.9%. A part of this difference can be attributed to the strengthening of the USD against the EUR as mentioned above.
The community surrounding The MarketFighter Strategy keeps growing, and I’m receiving a lot of great questions. I recently created a new FAQ page, where I’ve tried to answer all the most common questions from readers:
➡️ New FAQ
Monthly performance
The chart below shows the performance of the strategy (purple) compared to the MSCI World Index (gray) month by month in 2026:
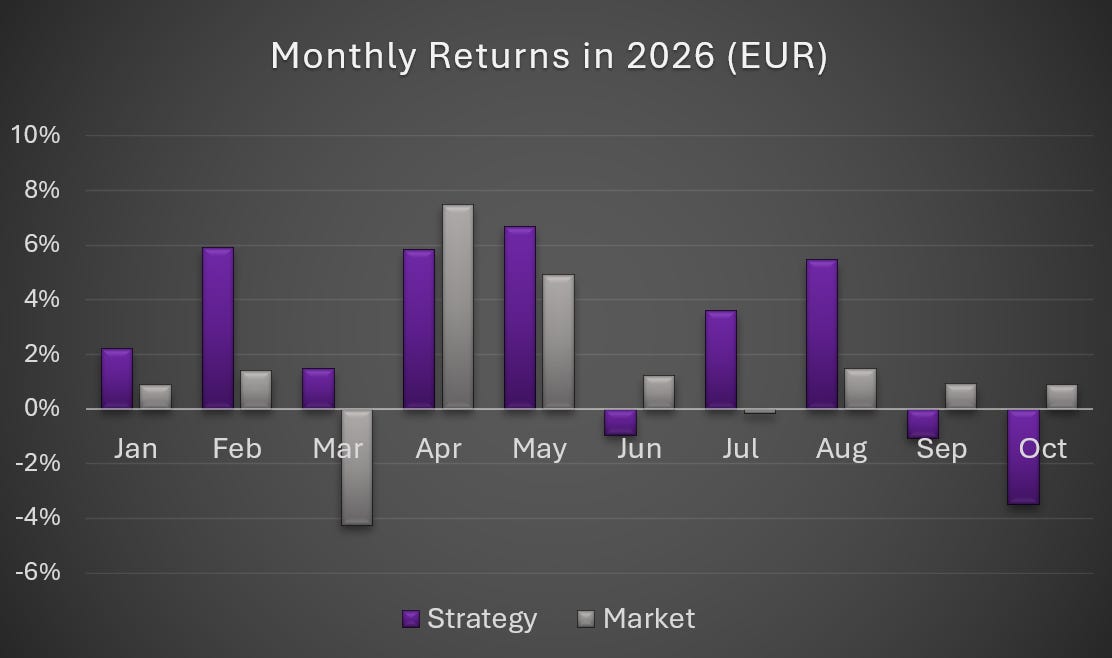
As usual, all numbers I present in these reports are measured in EUR and based on the underlying indices (not accounting for individual fees or taxes). The S&P 500 is measured in local currency (USD).
For most of October, the performance was slightly below the benchmark. Due to a heavy sell-off in tech stocks on the last trading day of the month, it ended in a 3.5% loss and a relative underperformance of 4.4%.
Over the full backtested history of the strategy, it has outperformed the market in 62% of the months and underperformed in 38%. After an incredible run in the first 8 months of 2026, the last two months have brought us very close to the average (outperforming in 6 out of 10 months).
Why your numbers may be different
A couple of readers have pointed out that their returns for October were worse than my reported numbers. It’s important for me to ensure everyone knows why that is, so they don’t confuse the numbers.
The primary reason is currency. The USD gained 1.5% vs. EUR in October. This means USD-based investors had returns 1.5% lower than EUR-based investors this month. For GBP-based investors in the UK, it was even worse.
Currency fluctuations are a natural part of investing globally. They’re not a definitive pro or con for anyone. What you lose in one month, you may gain in the next. In the long run, the effect of currency fluctuations tends to become very small.
The other major reason I’ve noticed is comparing returns over different dates. A monthly comparison from October 2 to November 2 does not show the same performance as the monthly closing prices I always use (September 30 to October 31).
For example, the US-listed ETFs registered losses of 8.3% (XLK) and 1.8% (VLUE) respectively. This amounts to a combined loss of 5.1%, roughly 1.5% worse than the 3.5% EUR numbers, in line with the 1.5% gain in USD vs. EUR.
2026 Year-To-Date
The chart below shows the accumulated returns the strategy has generated so far in 2026. I have included the S&P 500 as well (still measured in local currency).
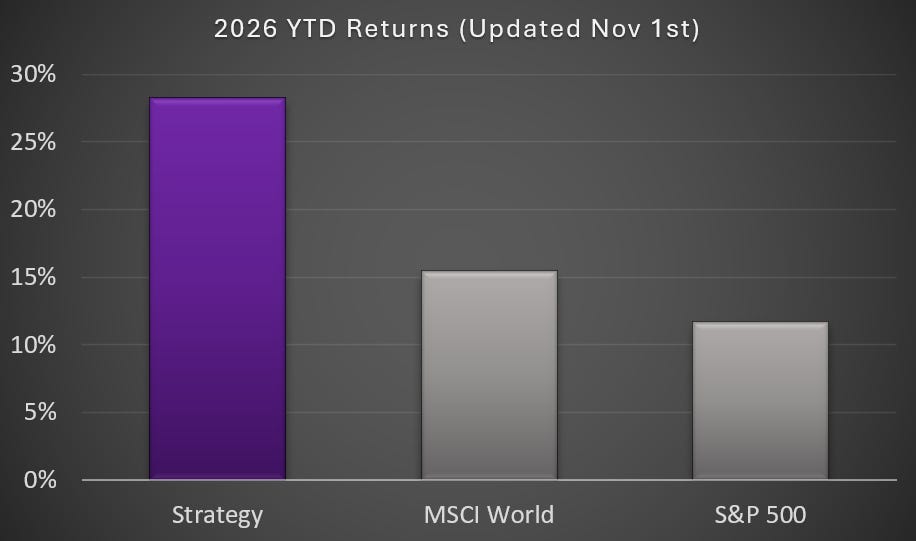
Finance tends to draw all our attention to what happened in the past few days or weeks, while what really matters to most of us is the long-term outcome.
Despite the losses of the past two months, the strategy is still significantly ahead of both the MSCI World Index (EUR) and the S&P 500 (USD) in 2026.
With two months left, the system is closing in on a 10th consecutive year of outperforming the S&P 500, and the 14th straight year outperforming the MSCI World Index. This includes live trading and backtested years.
ETF allocations in October
At the beginning of October, we switched the sector allocation from Energy to Information Technology, while the factor allocation remained in US Value:
🌍 Factor ETF: US Value
🏢 Sector ETF: Information Technology Sector
As always, the allocation change was a result of executing the same monthly rules that produced the historical performance of the strategy.
Looking for the November ETFs?
If you’re curious to know which two ETFs the strategy is now allocated to for November, find them here:
Monthly breakdown
The exact monthly returns in 2026 can be found in the table below, along with market returns (based on the MSCI World Index) and the difference (alpha) between them:
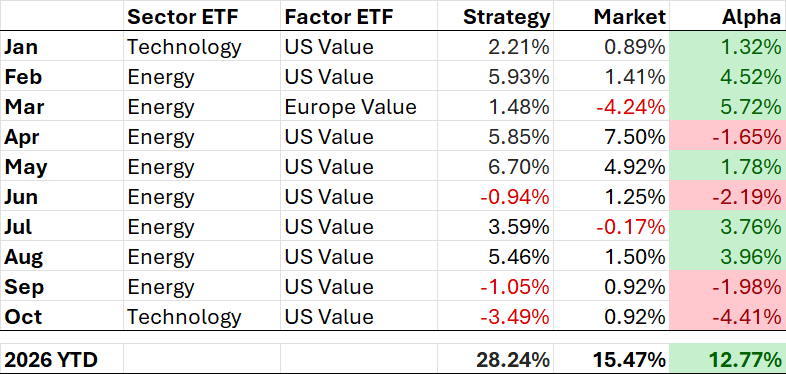
In the first ten months, we have seen fewer allocation changes and better returns compared to an average year. The most important number here is the +12.77% of outperformance compared to the market.
The big picture
One thing I’ve learned during 22 years of investing is that zooming out tends to help us understand the bigger picture. October was no fun, but here’s a fun fact, which I briefly mentioned in the introduction:
In 7 of the last 8 years (2018-2025), the strategy had a month with worse performance than this October. Yet, it outperformed the S&P 500 for the full year in all 8 of them.
Most of the bad decisions I’ve made in the past came from short-term thinking. Small reminders like this one will be a continuous part of this newsletter, as I share my thoughts on the process and its outcome.
To complete the big picture, I just updated the annual returns table with fresh 2026 figures up until November 1st:
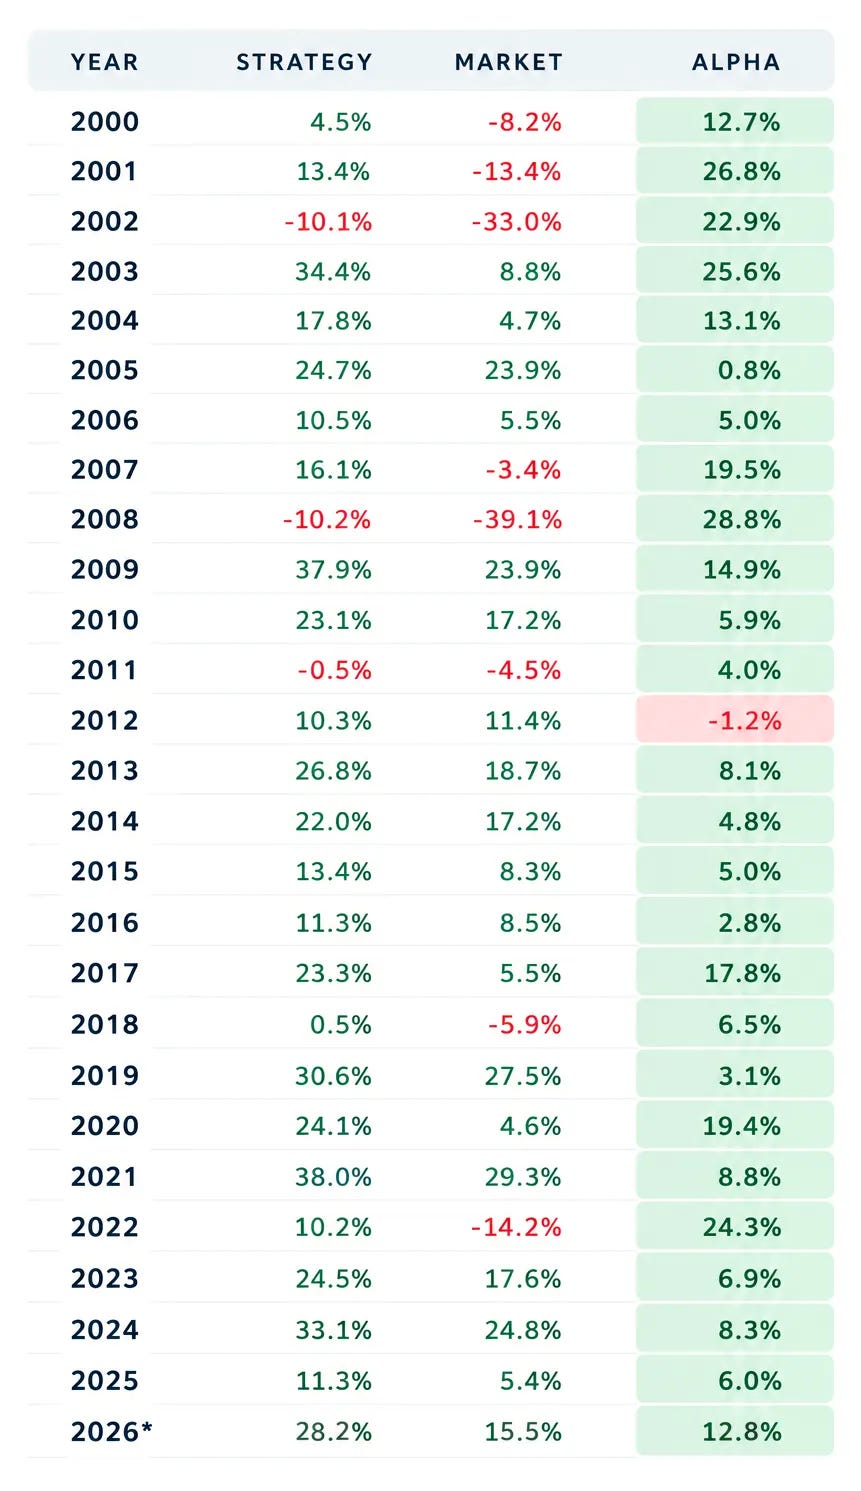
Of course, these returns required strict discipline to follow the rules in every single month, and October was a good example of why that isn’t always easy.
If you’re not part of this journey yet, don’t forget to subscribe. I write a number of free articles with strategic and data-driven market insights every month.
If you want full access to the strategy and receive the monthly trading signals, simply upgrade to a paid subscription to join us.
Thanks for reading!
(On iPhone or iPad? You can get a lower rate by purchasing at substack.com or at marketfighter.com in a browser, instead of through the Substack app. You will still get full access in the app afterwards.)
Disclaimer: The MarketFighter Strategy is for educational and informational purposes only. It is not financial advice, and the author is not a licensed investment advisor. Investing in ETFs involves significant risk, and past performance is never a guarantee of future results. You are solely responsible for your own trades and financial outcomes. Read the full Disclaimer here.
Same here. It’s not because we don’t like the recent results that we don’t like the strategy.
Appreciate the transparent update! Downs are a part of long-term growth, so I'm happy to trust the process and stay the course for the Long run 💪🏽