


Hi friend 👋
This is the monthly performance report for The MarketFighter Strategy. It’s the simple rules-based strategy I’ve been following for more than five years and share with subscribers in this newsletter.
Every month I give you a fully transparent update on how the strategy performed over the past month, as well as over a longer time horizon.
Hundreds of members are already actively tracking the strategy, and I appreciate your feedback and support. Thank you to everyone who is following along!
New to The MarketFighter Strategy?
I write about a simple approach to beat the stock market with only 15 minutes of monthly work that anyone can copy. Check out these links:
Our September
The community surrounding the strategy keeps growing, and so does the attention from all angles. Over the course of September my work was published in three other publications, and I was interviewed by a Substack expert blogger.
You can find all these posts at www.marketfighter.com.
In the meantime we just reached 4,000 subscribers, with more than 200 members now actively tracking the strategy. Your trust means a lot to me, and I’m very excited to have you all with me on this journey.
In terms of performance, the strategy took a breather after a strong run, registering a minor loss of -1.05% in September. Meanwhile, the MSCI World Index gained 0.92% (both in EUR). The S&P 500 had a small loss of -0.45%.
It’s worth noting that the US Dollar had a strong month against the Euro, which means EUR-based investors experienced higher total returns than USD-based investors.
Monthly performance
The chart below shows the performance of the strategy (blue) compared to the MSCI World Index (gray) month by month in 2026:
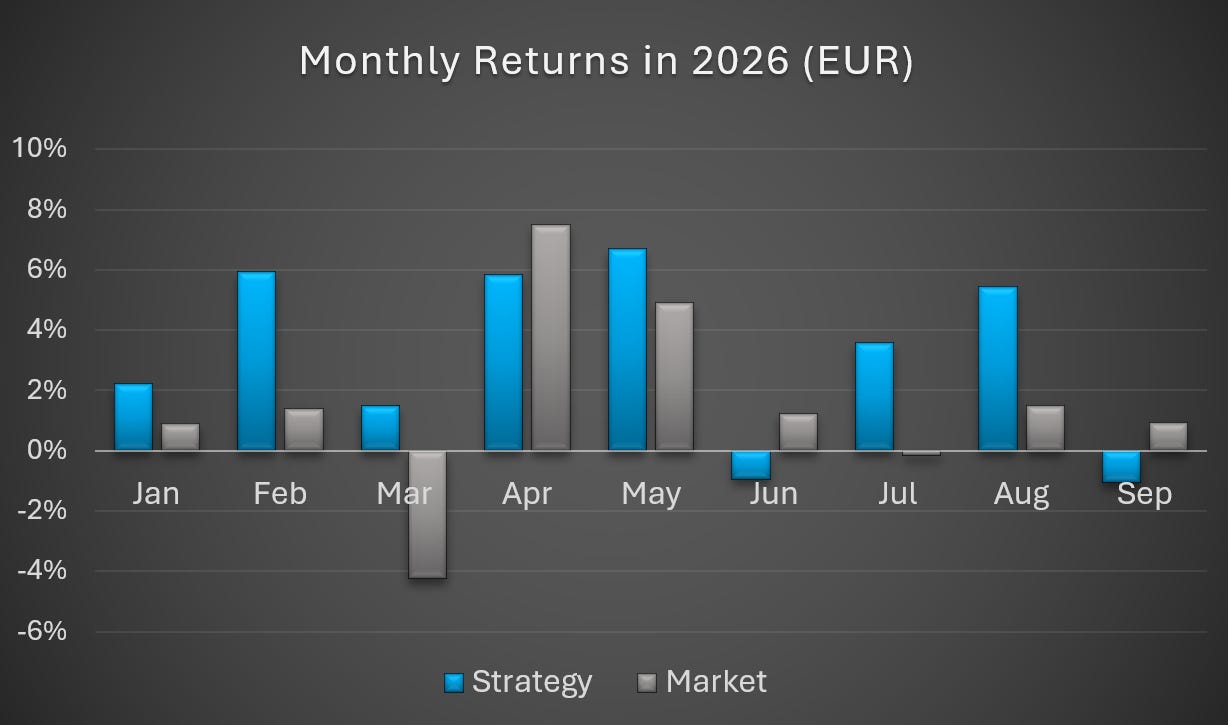
As usual, all numbers I present in these reports are measured in EUR and based on the underlying indices (not accounting for individual fees or taxes). The S&P 500 is measured in local currency (USD).
The small underperformance in September was very similar to what we experienced in June and represents nothing out of the ordinary.
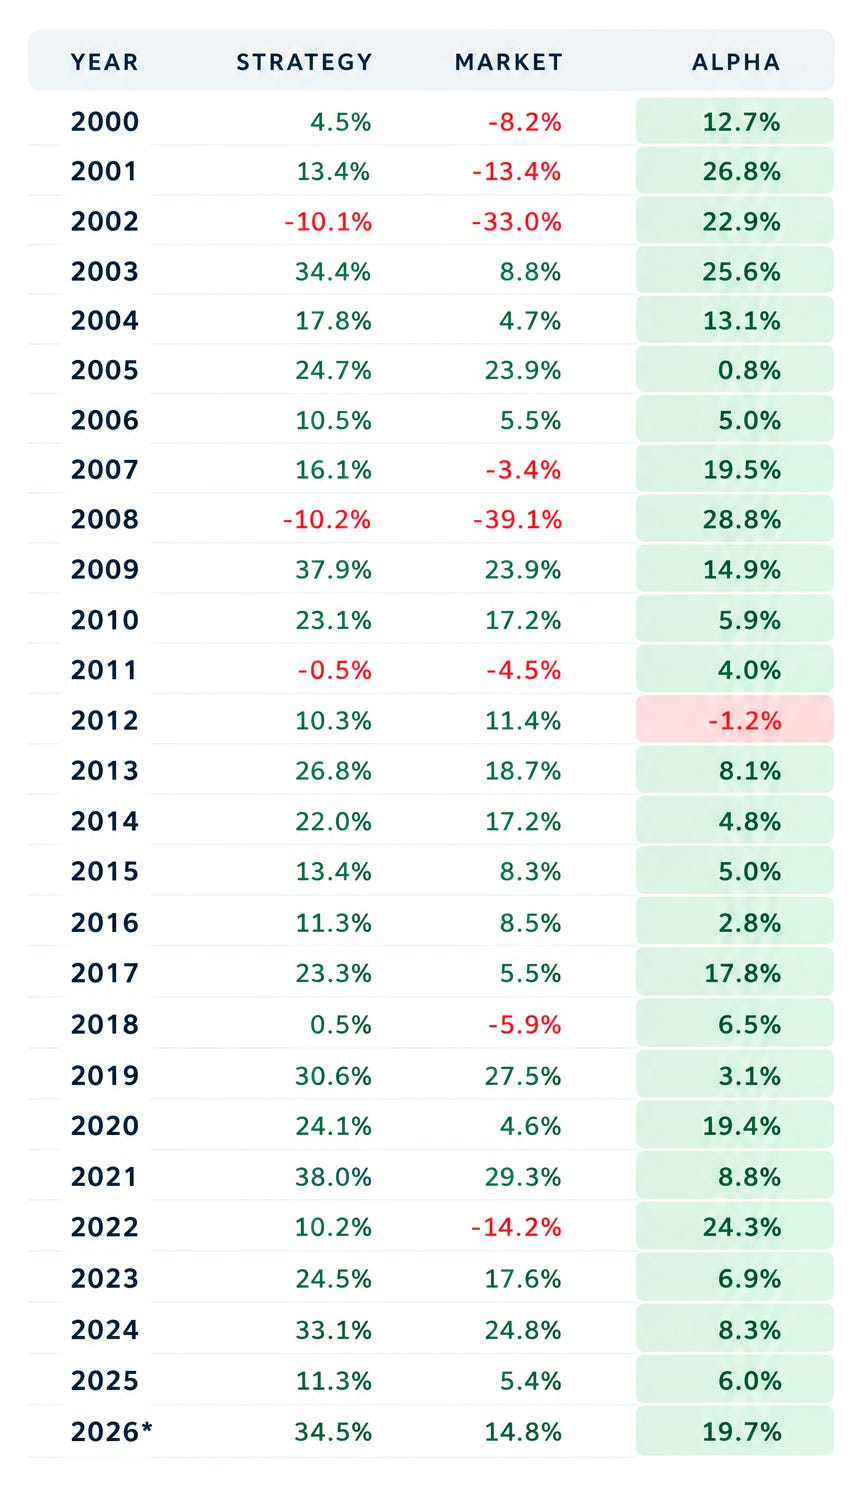
Over the past 26 years, the strategy has averaged 7-8 months of outperformance every year, and 4-5 months of underperformance. Many years have of course been better or worse than these averages, but it gives you an idea of what has been typical.
If you’re a USD-based investor looking for more US-specific numbers, I have collected a lot of historical data and comparisons in this article:
➡️ I Switched My Strategy to USD and My Benchmark to S&P 500. Here’s What Happened.
2026 Year-To-Date
The chart below shows the accumulated returns the strategy has generated so far in 2026. I have included the S&P 500 as well (still measured in local currency).
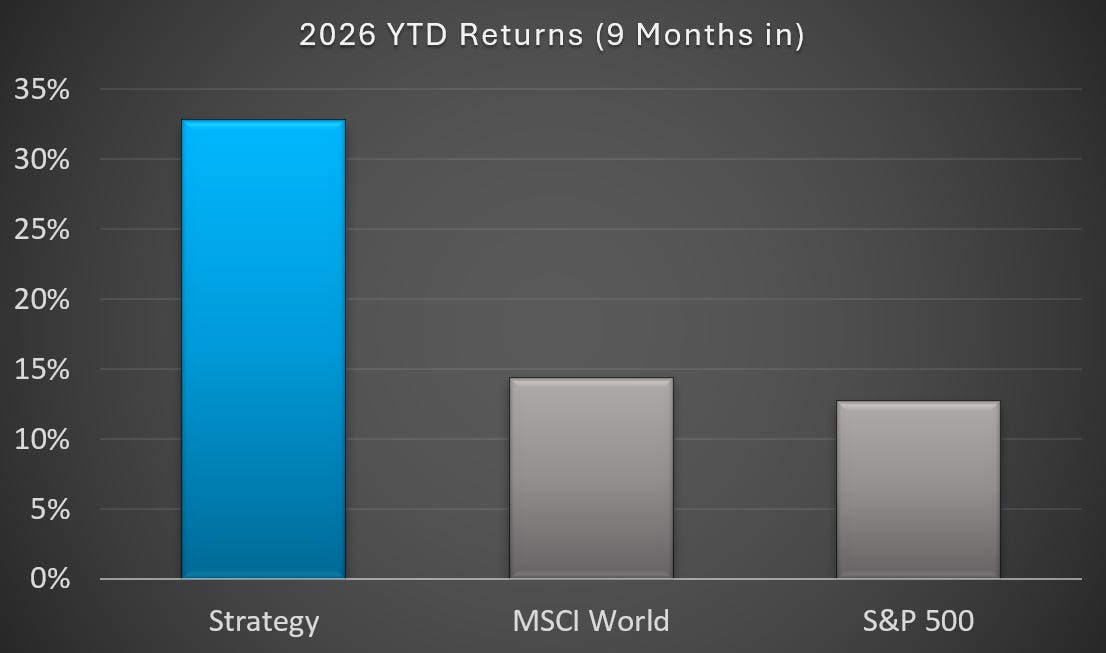
Despite the small loss in September, the strategy is still 18-20% ahead of our market benchmarks in 2026, and still on track to beat the market for the 6th time in 6 years since I started trading the strategy with my own money.
ETF allocations in September
Again, the system was allocated to the same two ETFs in September as in the previous months:
🌍 Factor ETF: US Value
🏢 Sector ETF: Energy Sector
This marked the fifth consecutive month without having to interfere with the system or make changes to positions.
Looking for the October ETFs?
If you’re curious to know which two ETFs the strategy is now allocated to for October, find them here:
Monthly breakdown
Our exact monthly returns in 2026 can be found in the table below, along with market returns (based on the MSCI World Index) and the difference (alpha) between them:
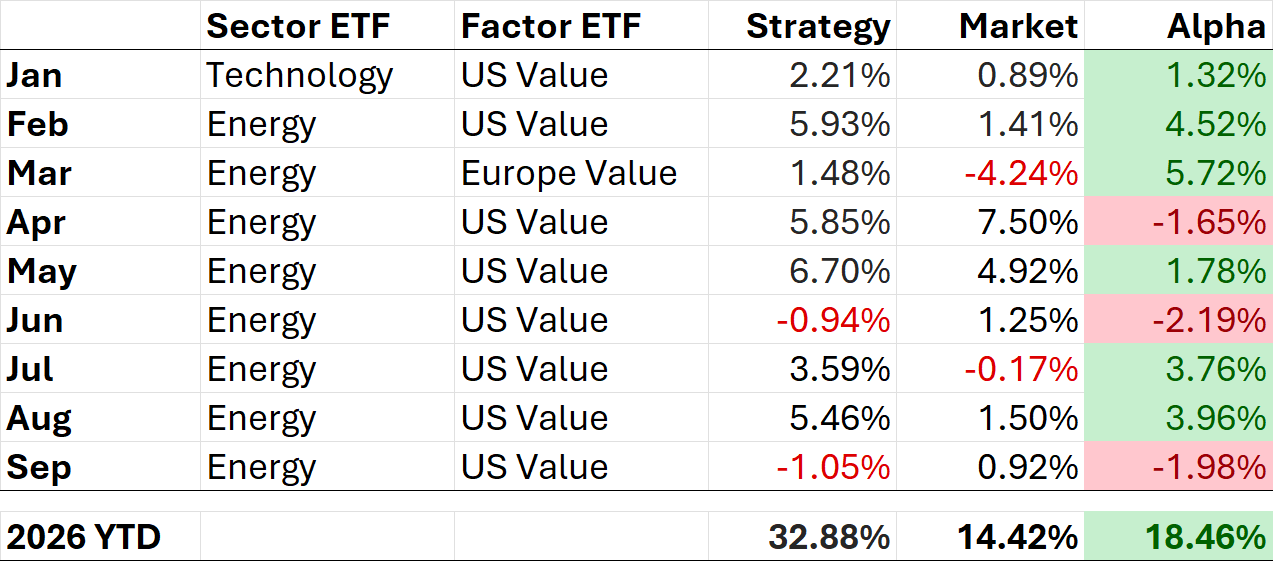
The allocations for both sectors and factors have been more consistent than in most years. This is usually a sign of long and strong trends, forming a great foundation for the momentum-based strategy to thrive.
Despite this month’s minor dip, the strategy is still 18.46% ahead of the MSCI World Index in 2026.
Updated annual returns
I was recently invited by the Substack publication Macro Notes to write an article for their 60,000 readers about my strategy (read it here if you’re interested).
As part of writing this article, I updated my calendar-year returns table with the latest figures for 2026 YTD (as of last week):
If you’re not part of this journey yet, don’t forget to subscribe. I write a number of free articles with strategic and data-driven market insights every month.
If you want full access to the strategy and receive the monthly trading signals, simply upgrade to a paid subscription to join us. (Psst: If you’re on iPhone or iPad, you can get a lower rate by purchasing directly at marketfighter.com in a browser, instead of through the Substack app. You will still get full access in the app afterwards!)
Thanks for reading!
Disclaimer: The MarketFighter Strategy is for educational and informational purposes only. It is not financial advice, and the author is not a licensed investment advisor. Investing in ETFs involves significant risk, and past performance is never a guarantee of future results. You are solely responsible for your own trades and financial outcomes. Read the full Disclaimer here.