


This is the monthly performance status for The MarketFighter Strategy. It’s the systematic strategy I have followed for the past five years and share with subscribers of this newsletter.
As always, I’ll give you a fully transparent look into the monthly performance, my comments on the current status, as well as an update on the full year so far.
New to The MarketFighter Strategy?
I write about a simple approach to beat the stock market with only 15 minutes of monthly work that anyone can copy. Check out these links:
Strong results again in August
I’m deeply grateful for the growing number of investors joining me on this journey every day. The pleasure is even bigger when I can show this level of excess returns that current subscribers have witnessed.
August was no exception with a return of 5.46% while the MSCI World Index returned 1.50%. The S&P 500 gained 2.62% over the same period.
The chart below shows the performance of the strategy (green) compared to the MSCI World Index (gray) month by month:
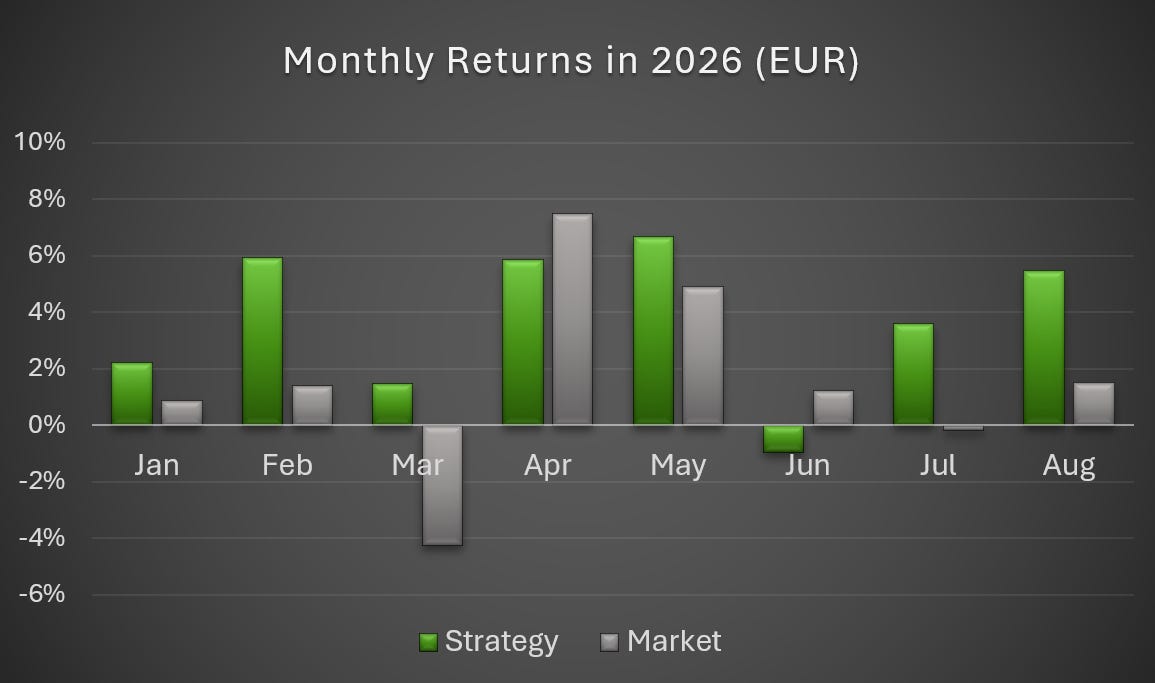
As usual, all numbers I present in these reports are measured in EUR and based on the underlying indices (not accounting for individual fees or taxes). The S&P 500 is measured in local currency (USD).
I always say that any serious investment strategy should be evaluated in years or decades, not months or weeks. Anyone can have a few good or bad months, but it doesn’t mean it will continue this way forever.
There’s no doubt that those of us who follow this strategy have had a great run recently, but this predicts neither good nor bad returns for the near future.
What I really care about is long-term consistency, and I would much rather be measured by this. I recently wrote an article about it, in which I also provided a USD-based return overview for the strategy. Find it here, in case you haven’t read it:
➡️ I Switched My Strategy to USD and My Benchmark to S&P 500. Here’s What Happened.
Year-to-date status
Below is an accumulated chart of the returns generated so far in 2026. I have included the S&P 500 as well (but be aware that it is not currency-adjusted).
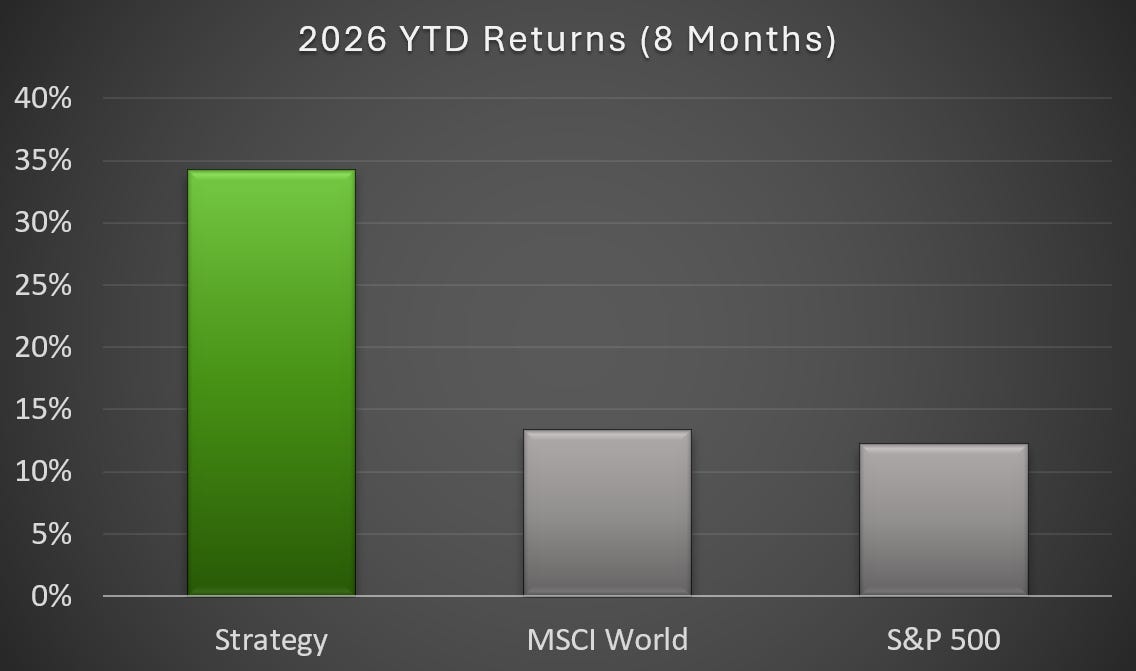
Regardless of how we measure it, the strategy is having an above-average year, generating significantly higher returns than our benchmarks, and also higher than the averages for the strategy itself.
We can’t know how long this will continue, and I will never attempt to make predictions. I simply keep following the same rules as I have done for 66 months now.
ETF allocations in August
The system held the same two ETFs in August as in the previous four months. This time both allocations outperformed the market benchmarks in a strong month without much volatility. These were our positions:
🌍 Factor ETF: US Value
🏢 Sector ETF: Energy Sector
A couple of readers have asked if we should worry about single stocks accounting for more than 20% of the weight of the ETFs we use for the strategy.
Compared to a standard market-wide ETF, 20%+ may seem high, but when using factor- and sector-focused ETFs it comes as a natural side-effect that a few major players often take up a significant fraction of the invested amount.
Historically, this higher concentration has often been an advantage, helping secure excess returns compared to benchmarks. Personally, I’m not particularly worried about it, as history suggests the system has done well over time with this setup.
Allocations for September
Looking for the new September trading signal? If you’re curious about which ETFs the strategy is currently allocated to, find it here:
Monthly breakdown
The table below shows the exact performance of the strategy on a monthly basis compared to the market (the MSCI World Index), as well as the alpha (the difference between our return and the market return):
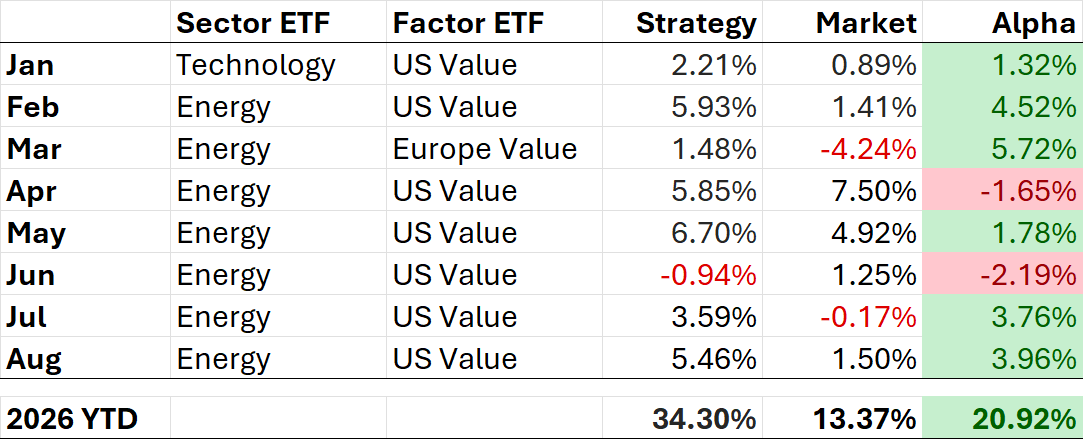
Our allocations for both sectors and factors have been remarkably steady so far this year. The most important number for me is the 20.92%, representing our excess return compared to the world index.
This is already above the average annual alpha for the strategy. However, as mentioned before: the current performance numbers (or allocations, for that matter) do not help us predict what will happen in the remainder of the year.
There are many strategies out there presenting higher returns than this one. The problem is almost always what happens in bad times. I follow this strategy for its high floor and consistency, more than for its absolute ceiling.
Coming up next
This publication has gained a lot of traction recently, and a growing number of interesting people are reaching out to me. This has led to exciting new collaborations.
Two weeks ago, I participated in this collaboration article together with six other amazing writers from the Substack Finance space, about how we invest:
➡️ Seven Figures: A Roundtable
Next week I will share my first guest post in this publication with you. It’s being written for us by another Substack Finance writer with a different perspective on ETF investing. I hope you will enjoy it.
If you’re not part of this journey yet, don’t forget to subscribe!
If you want full access to the strategy and receive the monthly trading signals, simply upgrade to the paid subscription to join us. (Psst: You get the best price by doing this through a web browser and not inside the Substack mobile app!)
Thanks for reading!
Disclaimer: The MarketFighter Strategy is for educational and informational purposes only. It is not financial advice, and the author is not a licensed investment advisor. Investing in ETFs involves significant risk, and past performance is never a guarantee of future results. You are solely responsible for your own trades and financial outcomes. Read the full Disclaimer here.
Combining Value factor assets with a high vol asset is actually a nice way to gain a higher sharpe ratio in one's portfolio. One of the drawbacks to owning high momentum assets is they are prone to unexpected regime shifts. The Value factor asset becomes a sort of self balancing barbell, when high vol is down Value a lot of times is up due to risk balancing.
This can reduce the severity of drawdown and volatility in the portfolio.
I agree it's the right approach to evaluate your performance over a multi-year timeframe. That said, your results this year are impressive, and all I can say is: Keep crushing it!