How to Avoid Market Crashes - The Ultimate Drawdown Strategy
Most investors are aware that the historical average annual return on the stock market is between 7 and 10% depending on how you measure it. In almost three out of four years, it gives a positive return, but occasionally there are bad and prolonged drawdowns as we saw in 2000-2002 (the tech bubble) and in 2008 (the great financial crisis). If only there was a way to ease the pain of these drawdowns, investing would be so much easier. Right?
Is it possible to time the market?
In general, I'm not a firm believer in market timing. I've tried it myself with no impressive results, and all theory says you should avoid it. "Just buy index funds and hold for the long term" seems to be the general mantra - and it's probably also the best strategy for most people.
But in my countless experiments on historical data, I discovered a simple mechanism that avoided most of the bad drawdowns during the past 80 years. Caught your attention? In the remainder of this post, I will explain the strategy and show the results.
How to create a strategy that works
As investors in the stock market, our worst enemies are emotions and human psychology. That's why any useful strategy on the market is based on fully automatic systems. The systems need to be free from human interaction and only take input from quantitative data. And the person utilizing the system needs to be disciplined enough to follow it and stick to it. The latter is harder than it may seem.
Basically, you need to define exactly what to do and under which circumstances - leaving no doubt for you to worry about, no matter what happens in the markets. I recently wrote another post about beating the market with systematic strategies, for inspiration.
Trading rules for the Drawdown Strategy
The strategy is based on the S&P 500 index, which I generally use to represent the market. To simplify the description below, I use the variable P to hold the price of the index. The subfixed number defines the number of months to look back - for instance, P0 is the current value of the S&P 500, while P6 is the value 6 months ago.
The Drawdown Strategy consists of three simple rules:
- P0 < P1 (current price must be lower than 1 month ago)
- P0 < P6 (current price must be lower than 6 months ago)
- P6 < P13 (6 months ago must be lower than 13 months ago)
The rules must be checked at the end of each month. When all of them are true, sell everything and stay in cash for the month. In all other cases, buy and hold the S&P 500 index.
The first two rules simply state that the current price of the S&P500 index must be lower than 1 month ago and at the same time lower than 6 months ago. The third rule may seem a bit odd, but it turns out that the largest drawdowns tend to come after long top formations, and comparing the price 6 months ago with 13 months ago turns out to be a great predictor of major drawdowns.
And now the chart you've been looking for:
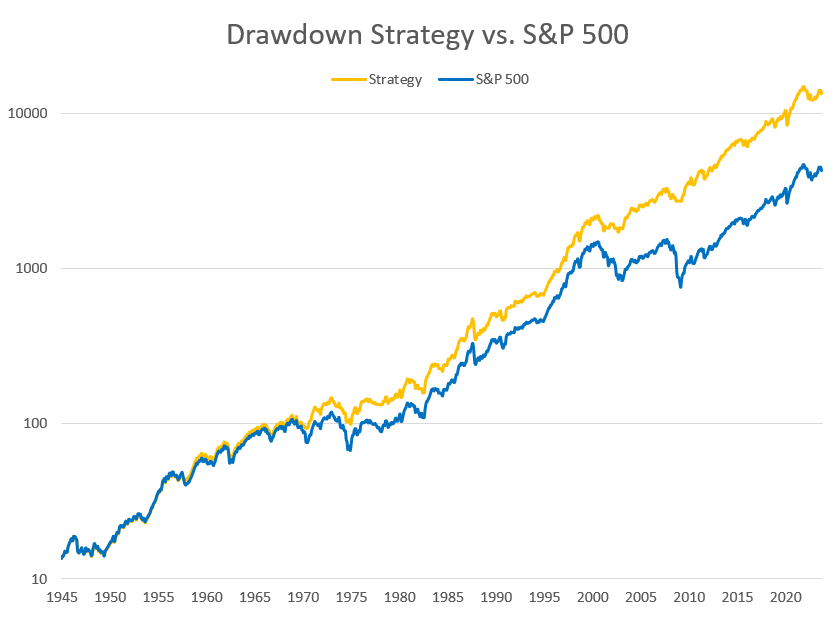
In this chart, I have backtracked to 1945 and compared the strategy with the S&P 500 index (using log scale). The majority of the time the strategy simply follows the index. This happens 93% of the time, to be exact. In the remaining 7% of the months, it shifts to cash, and this is what causes the orange line to have smaller drawdowns than the index.
You may notice the difference in some of the well-known crashes in the chart. I have listed a few of the worst ones below with the drawdowns for each of the investments:
| Drawdown Period | S&P 500 | Strategy |
|---|---|---|
| The 1970 Crash 1969 - 1970 | -29.0% | -17.1% |
| The Second Oil Crisis 1973 - 1974 | -43.4% | -32.2% |
| The Dot-Com Bubble 2000 - 2003 | -43.7% | -21.4% |
| The Second Oil Crisis 2007 - 2009 | -50.8% | -17.3% |
You may notice that these drawdowns are month-to-month numbers. For instance, during the great financial crisis, the index actually fell more than 56% at the worst point. But since we're only checking this strategy once a month, our drawdown numbers are typically smaller.
By avoiding some of the worst drawdowns with this strategy, we won't just get better sleep at night. We will get higher total returns in the long run as well because the CAGR (annual return) of the strategy is higher than for the index:
| Investment | Value in 1945 | Annual return | Value in 2023 |
|---|---|---|---|
| S&P 500 | $1,000 | 9.13% | $998,000 |
| Strategy | $1,000 | 7.57% | $318,000 |
Thanks to the wonders of compounding, an investment of $1,000 in 1945 would be worth almost a million dollars in 2023 using our strategy - more than three times the value of a pure index investment! These numbers do not take inflation, dividends, or taxes into account, but the main point is: You can get higher returns with smaller drawdowns.
What about the Covid Crash in 2020?
The strategy has been designed to only require a monthly check-up. This makes it a lot easier to execute for most people and it maintains the focus on the long term. It also means, however, that it won't catch sudden crashes like the Covid Crash in March 2020 or the Black Monday flash crash in 1987. These are harder to predict, as the price data of the previous months will not indicate a forthcoming crash.
Will this continue to work in the future?
The short answer is of course, that nobody knows. In general, I believe that market mechanisms that haven't changed over the course of many decades or centuries are less likely to change in the future than one might think. But to be honest, while developing this strategy, I thought to myself: Is this too good to be true?
When defining a trading system, there's always a risk of overfitting an algorithm to fit with specific events of historical data. The simpler the rules, however, the smaller this risk should be.
Backtracking over 150 years
To gain more confidence in this system, I decided to take the rules to the test by applying them to data from the S&P 500 and its predecessors back to 1871. This includes more than 150 years of stock market history going from the Second Industrial Revolution through two world wars and The Great Depression all the way up to our digital era:
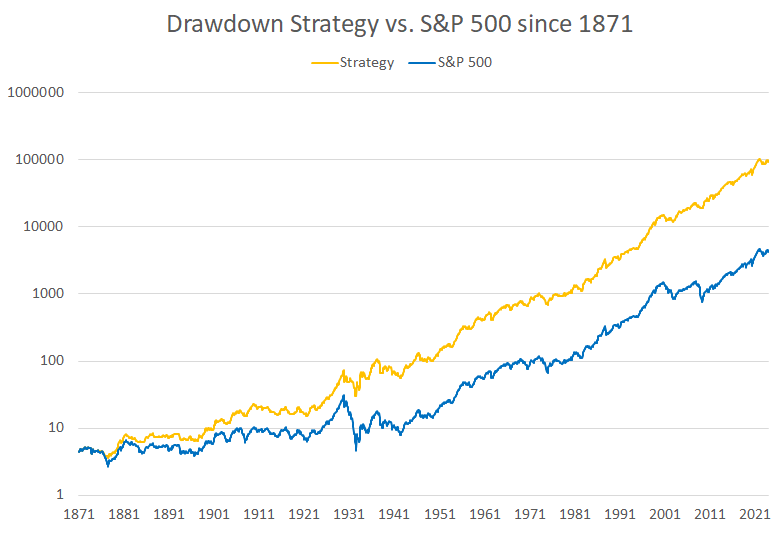
And the chart almost speaks for itself. The outperformance is already present from the beginning and only grows over time. When we get to 1945 where my original chart started, the algorithm has already beaten the index by a wide margin.
One particular point of interest in this chart is the period of The Great Depression around 1929-1932. During the worst market drawdown in history, our strategy lost 58.8% which is bad enough in itself. But the index at the same time lost 84.7%. That would leave us with approximately 3 times as much money left at the bottom with our strategy compared to a pure index investment.
Usage of the strategy
With the above backtesting in mind, I will say that this strategy is at least historically proven. As always, there are no guarantees for future returns, but personally, I'm already using this strategy as part of my investing setup.
You can even combine it with other strategies, meaning you don't have to buy the S&P 500 index. When the system exits and moves to cash, you simply exit whatever you're invested in and buy back, when the system buys back the S&P 500. This way you can apply the Drawdown Strategy to further optimize your existing strategies. If you want inspiration for strategies to apply with this, you may find this post relevant.