Does Momentum Investing Beat the Market in the Long Run?

Historically there has been a tendency for stocks that performed above average recently, to continue to do so. In this post, I will investigate if it's possible to build a viable long-term strategy based on momentum stocks for the buy-and-hold investor.
What are momentum stocks?
If you read my post about factor investing, you will know that factors describe certain characteristics of stocks that historically have led to outperformance. You will also know that the momentum factor is the one that on average has returned the greatest outperformance compared to the general market.
The most common construction of the momentum factor is to simply sort the components of a given market index (for instance the S&P 500) by the relative performance of each individual stock over the last 12 months. At some point, there will be a cut-off. This could be at 30% for instance - meaning that only the 30% of stocks with the best recent performance (12 months) will be considered for investing. Rebalancing is done every few months or so, to make sure only the stocks with the most momentum factor are included.
How to invest with the momentum factor
The process above may sound like a lot of work, but fortunately, there are ETFs that handle all of this for us. To invest with the momentum factor, you simply need to buy a momentum ETF. These are designed to track a market index and only invest in the stocks with the most momentum factor as described above.
So with this in mind, we are ready for the big question:
If momentum stocks have historically performed better than the general market, and there are cheap momentum ETFs available that handle all the selection logic, diversification, and rebalancing for us... Then, why don't we all just buy momentum ETFs?
What kind of returns can be achieved with momentum?
When investigating the momentum factor, Andrew Berkin and Larry Swedroe found that between 1927 and 2015 the 30% of US stocks with the most momentum had on average beaten the 30% with the least momentum by 9.6% annually.
This number is remarkable in itself, but what we don't know is:
- How does this translate into buying the top 30% and just comparing it to the market?
- How stable is the outperformance? Will there be long sequences of bad years?
To answer these questions, I have investigated the performance of the momentum indices provided by MSCI.
US Momentum Stocks
First off, to compare with Berkin and Swedroe's findings, I will look at MSCI's momentum index for US stocks, which tracks back to 1974. In the chart below I have calculated the CAGR (Compound Annual Growth Rate) for each decade and compared it to the general market using the MSCI USA index as the benchmark:
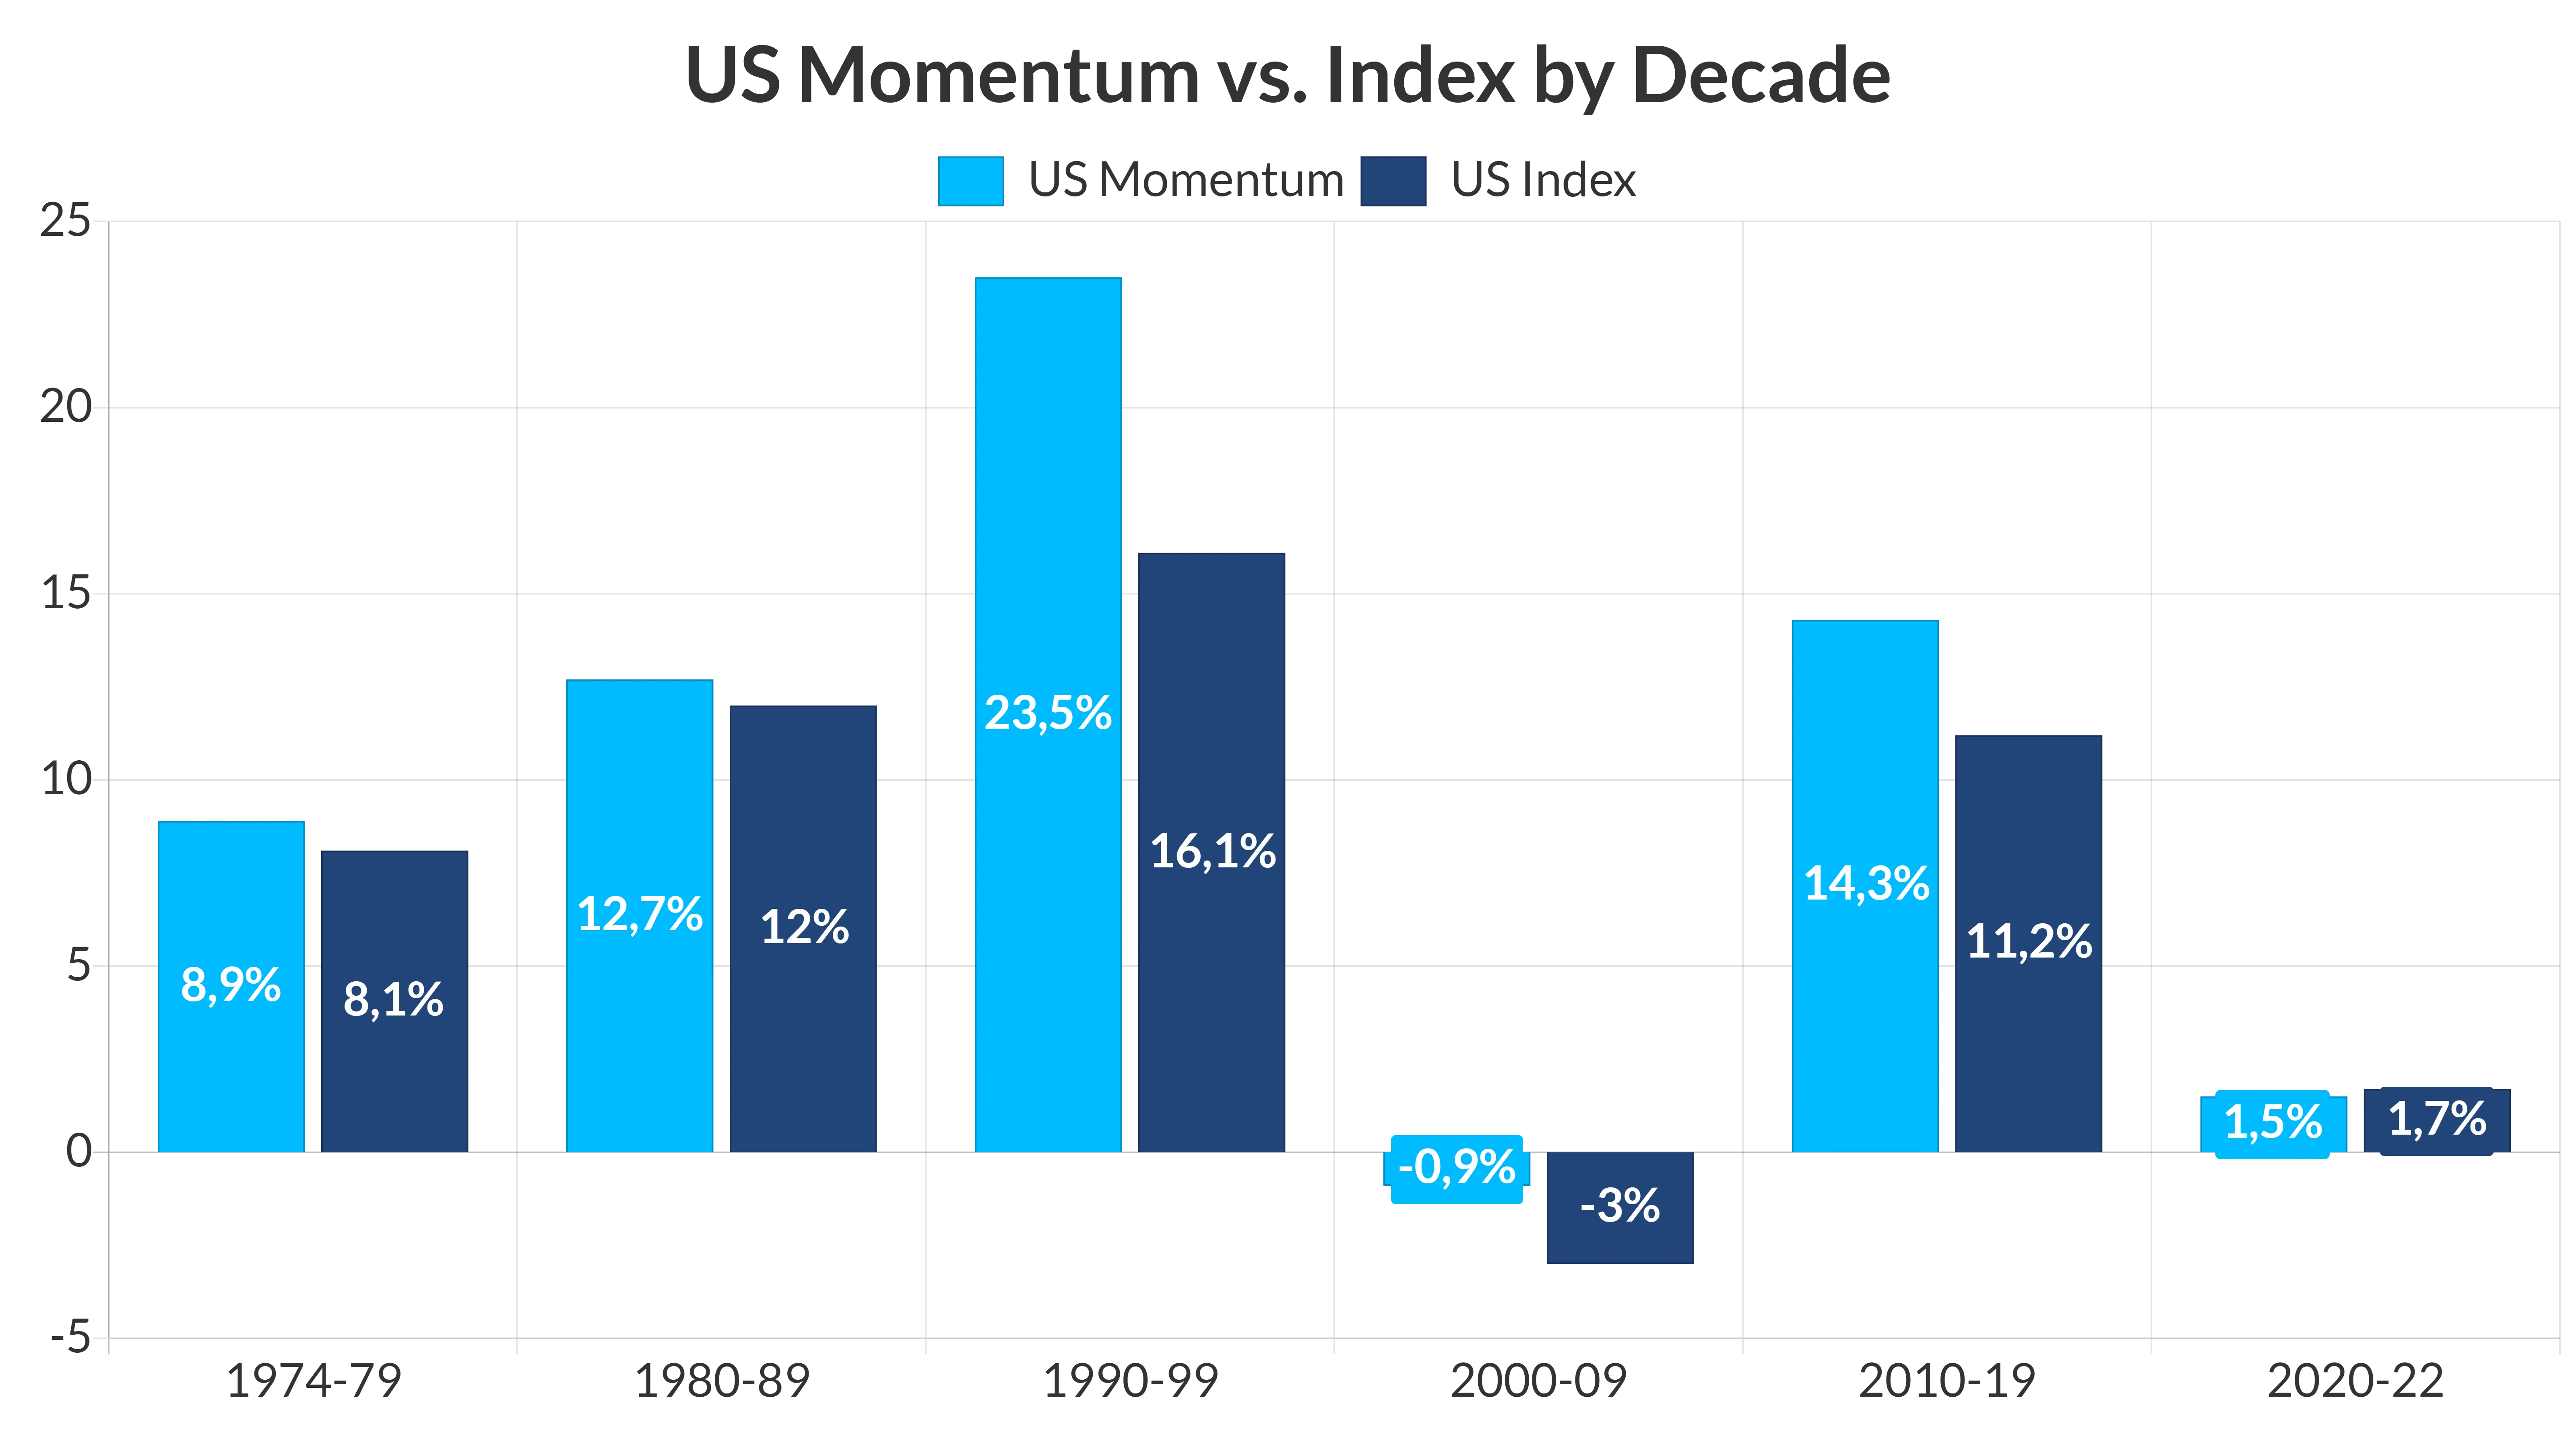
US Momentum Factor stocks clearly do have a premium, when held over the long run, even when we just compare the top 30% momentum stocks to the general market index. It's nowhere near the 9.6% found when comparing with low-momentum stocks, but it's definitely there.
However, the consistency of the outperformance is not as good as I was hoping for. If we remove the 90'es, where the tech boom continuously inflated the same group of stocks, the remaining decades look somewhat disappointing. Yes, the momentum stocks beat the index in all decades up until the 2020s, but the margin is so small, that I probably wouldn't bet on it.
World Momentum Stocks
The next thing I'm curious to see is if the momentum factor somehow had a bad run in US stocks. After all, it should have the same effect on all markets. Below I have made the same comparison, but this time using the MSCI World Momentum index compared to the general MSCI World index:
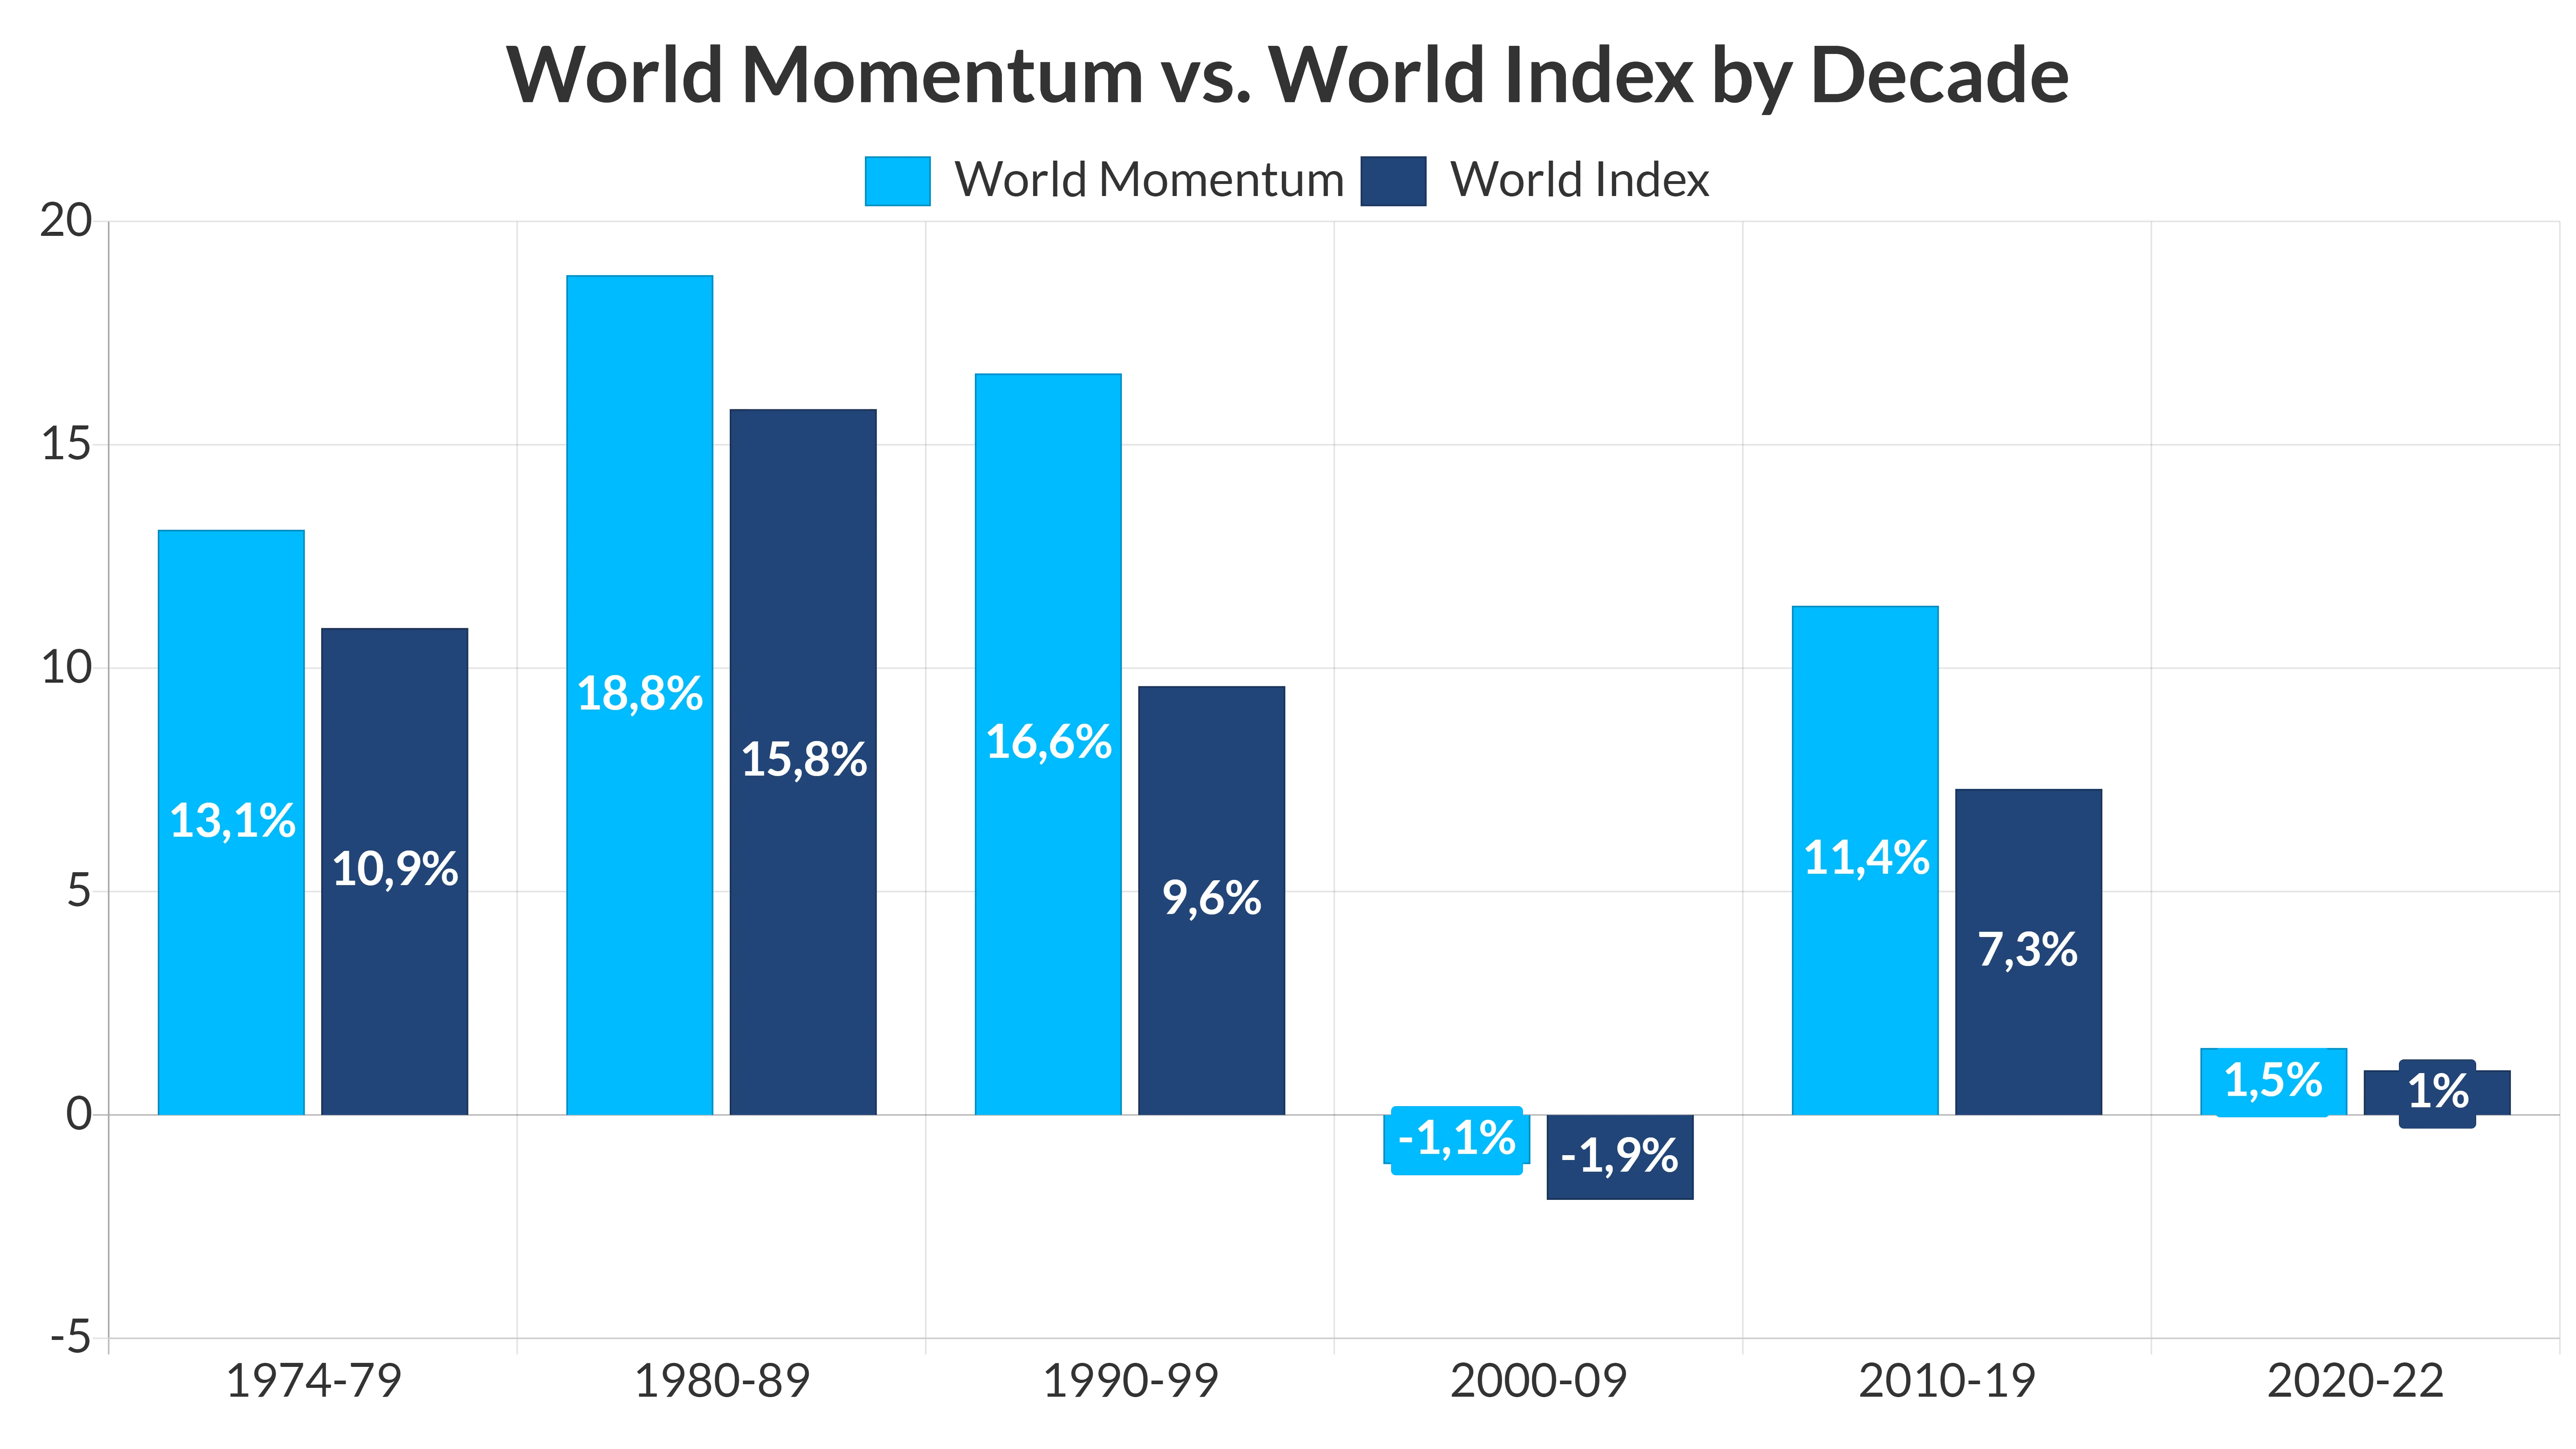
Now this looks a bit better. Now the premium is consistent across the decades, and it actually beats the market in every decade (with the data up until 2022 for the current one). The more consistent results may be a matter of the inherent diversification that comes from using the World index, rather than just looking at US stocks.
What may seem like fairly consistent premiums is always interesting, but I need to dig a step deeper, before I know if I would be interested in putting money in this strategy.
Below I have crunched the numbers for each year back to 1974 and calculated the relative performance of the MSCI World Momentum index compared to MSCI World - in other words: How much do momentum stocks gain or lose each year compared to an investment in the general world index?
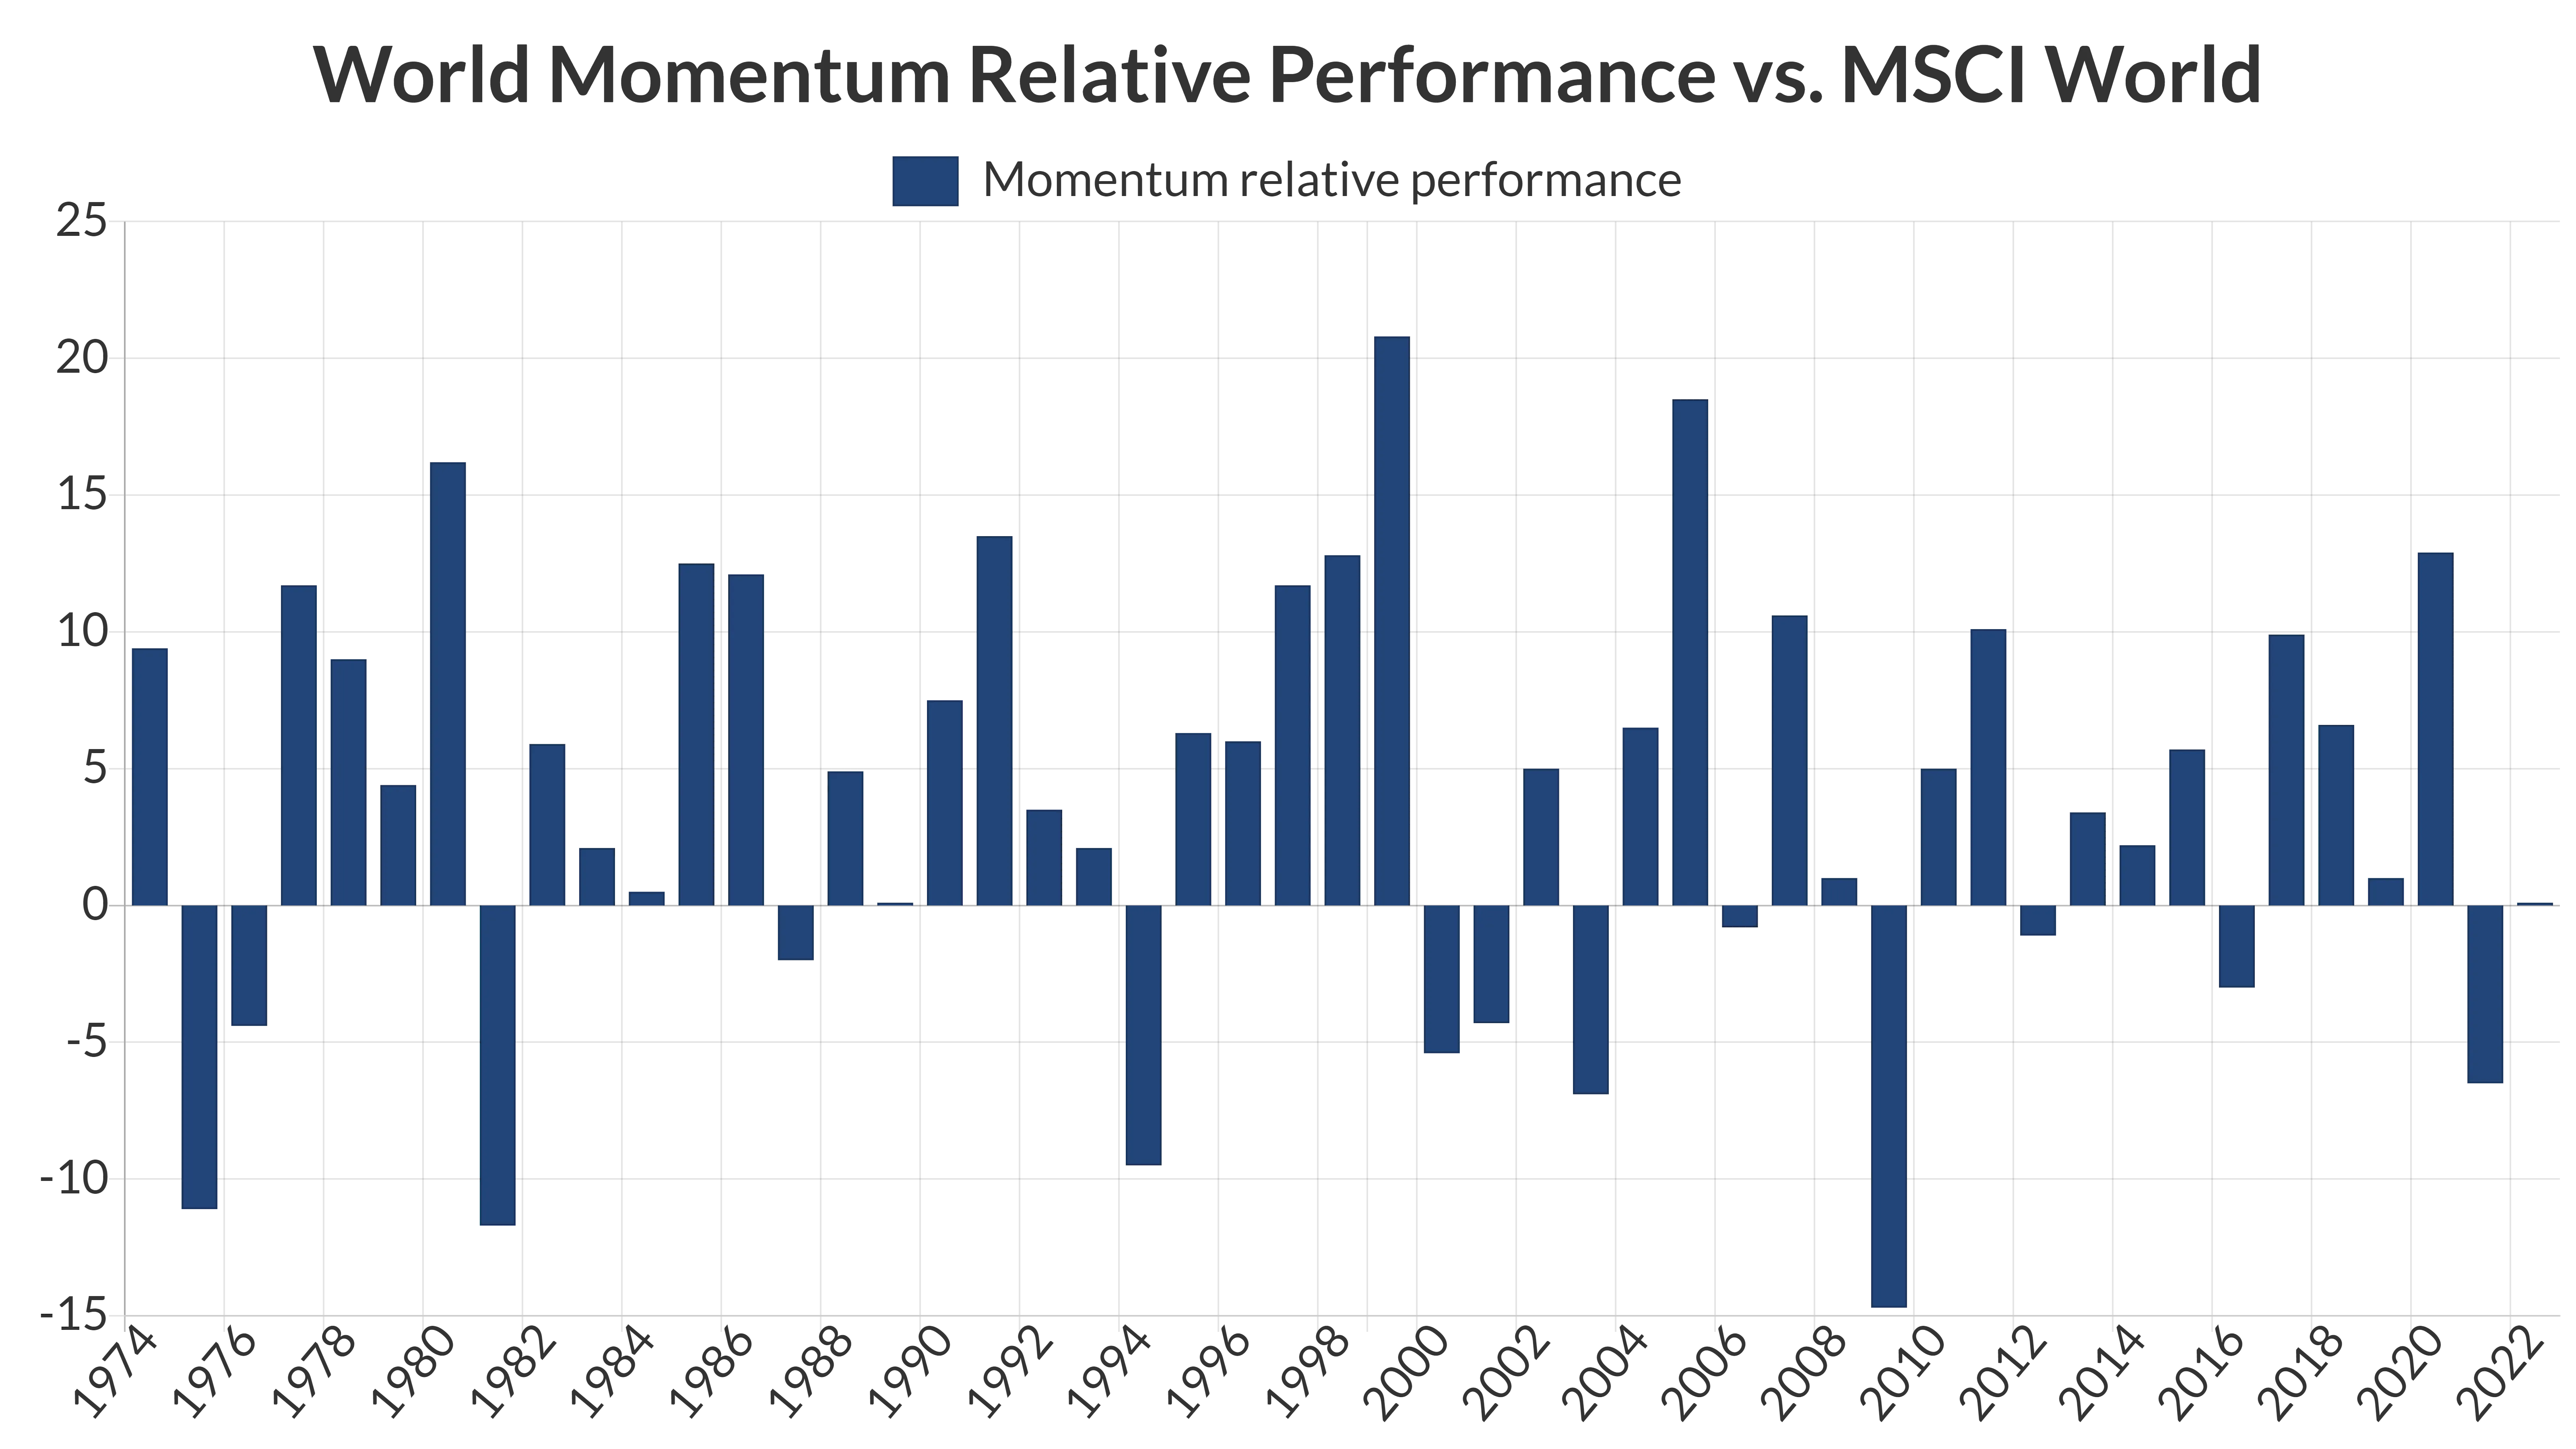
No doubt that most of the bars are on the plus side, meaning positive premiums for momentum stocks. But the drawdowns in bad years are quite heavy. Look at 2009, where the strategy lags the world index by almost 15%. If you decide to follow this strategy, you need to be able to stomach bad years like these and stick to the strategy. I know this is always easier in theory than in practice.
Personally, I think there are better investment strategies out there. For instance the Top 3 Sector Strategy has a slightly better average premium with much smaller drawdowns.
Fees and tracking error
As a final note, keep in mind that when following a strategy like this, you can never expect to earn the full index returns with ETFs. Most of all because ETFs always come with a small fee that drags the annual returns a bit (typically by 0.1% to 0.5%). There may also be small tracking errors because ETFs typically try to keep the number of internal transactions to a minimum in order to save money.